
Automation and Agents
How to Diagnose Enterprise AI Adoption with OpenAI Admin Analytics
Enterprise AI transformation fails when leaders track vanity logins. Here is how to diagnose true workflow adoption using OpenAI Admin Analytics.
On this page
- The Vanity Trap: Moving Beyond Token Counts and Active Seat Counts
- 1. The Disparity Between Exploration and Embedded Workflow
- 2. Uneven Value Distribution Across Job Roles
- 3. The Masking of Silent Friction and Failure Modes
- Core Architectural Components of OpenAI Admin Analytics
- Workspace Telemetry and User Segmentation
- Tool and Feature Telemetry
- Privacy and Confidentiality Boundaries
- The Four Diagnostic Cohorts: Segmenting Your User Base
- Cohort 1: Power Integrators (High Volume, High Tool Diversity)
- Cohort 2: Occasional Automators (Moderate Volume, Narrow Tool Use)
- Cohort 3: Stalled Explorers (Declining Volume, High Abandonment)
- Cohort 4: Dormant Seats (Zero or Near-Zero Activity)
- Designing an Actionable 30-Day Diagnostic Sprint
- Week 1: Identity Clean-Up and Baseline Auditing
- Week 2: Behavioral Funnel and Tool Utilization Analysis
- Week 3: Departmental Deep Dives and Qualitative Alignment
- Week 4: Governance Policy Rebalancing and License Reallocation
- Reallocating Capital: The License Optimization Protocol
- The 45-Day Inactivity Rule
- Floating License Pools for Intermittent Project Teams
- Measuring Seat Turnover and Net Adoption Health
- Designing High-Impact Enablement Clinics Based on Telemetry Data
- Remediation Clinic 1: From Prompts to Structured Workflows
- Remediation Clinic 2: Advanced Data Analysis for Non-Programmers
- Remediation Clinic 3: Building and Auditing Custom Departmental Agents
- Building an Executive Dashboard for Continuous Governance
- 1. The Operational Penetration Ratio
- 2. Advanced Feature Saturation Rate
- 3. Seat Velocity and Capital Efficiency
- 4. Qualitative Friction and Risk Sentiment
- Avoiding Five Common Diagnostic Pitfalls
- Pitfall 1: Penalizing Low-Frequency, High-Value Specialists
- Pitfall 2: Over-Indexing on Prompt Length
- Pitfall 3: Ignoring Negative Verification Loops
- Pitfall 4: Treating Enablement as a One-Time Milestone
- Pitfall 5: Failing to Close the Feedback Loop with Product Teams
- Conclusion: Turning Telemetry into Sustained Advantage
- Sources
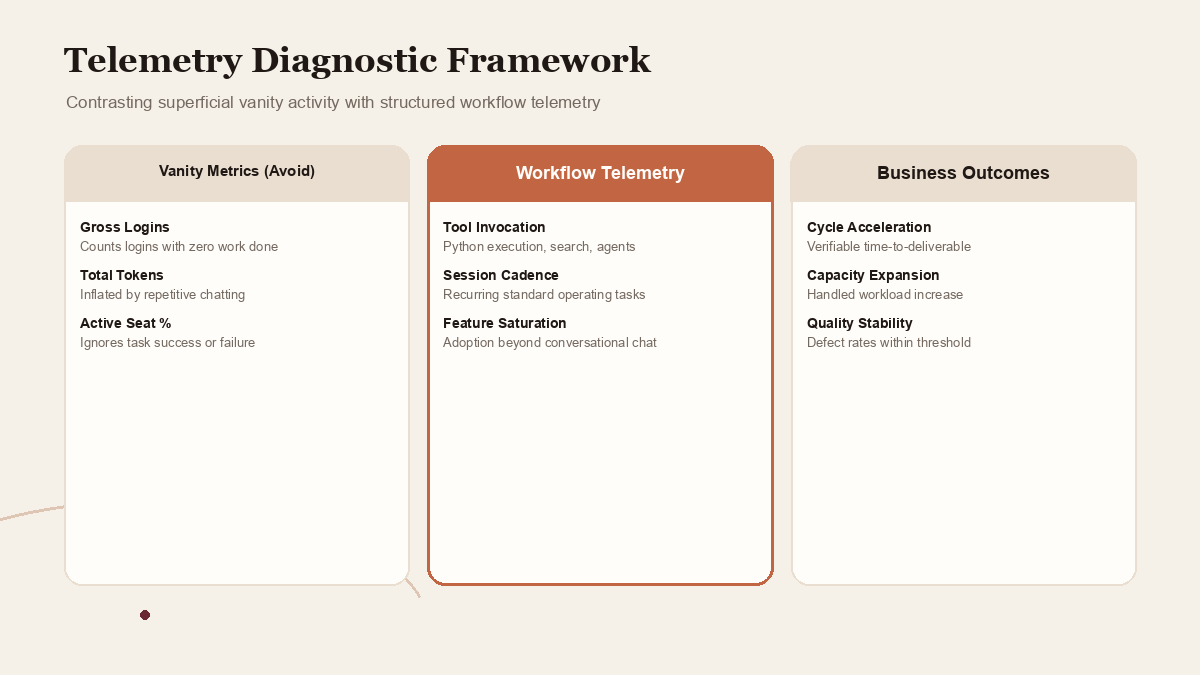
Enterprise leaders frequently discover that purchasing generative AI seats is the easiest step of an AI transformation. The harder step is discovering whether those seats produce genuine operational change or simply generate expensive vanity metrics. When organizations roll out ChatGPT Enterprise, ChatGPT Work, or GitHub Codex environments, initial executive reporting often leans on superficial engagement figures: total logins, active daily users, or gross token volume consumed across the workspace. However, these aggregate figures obscure the true health of organizational adoption. A department might consume millions of tokens generating casual summaries or repetitive prompt tests while business-critical workflows remain manual. Conversely, a high-leverage engineering or legal team might use relatively few tokens to solve complex bottleneck tasks that save hundreds of human hours each month.
Diagnosing genuine business adoption requires shifting from gross activity monitoring to structured workflow telemetry. With OpenAI Admin Analytics, administrators gain granular visibility into workspace patterns, departmental segmentation, feature utilization, and tool usage across enterprise tenants. But telemetry data is only as valuable as the analytical framework applied to it. Without a disciplined evaluation model, administrative dashboards become another passive reporting silo.
This guide provides a comprehensive, field-tested diagnostic protocol for enterprise IT directors, chief technology officers, and operations executives. By combining administrative telemetry with cohort segmentation, structured enablement interventions, and continuous governance, organizations can identify high-leverage user clusters, remediate adoption blockers, optimize license allocation, and ensure that AI deployments generate measurable business impact.
 View image detail
The Vanity Trap: Moving Beyond Token Counts and Active Seat Counts
The most pervasive failure mode in enterprise AI governance is confusing activity with productivity. In the initial months following an enterprise license rollout, procurement teams routinely report success based on seat activation rates. If 85 percent of provisioned employees have logged into ChatGPT or Codex within 30 days, the initiative is declared on track.
This assumption is fundamentally flawed for three structural reasons:
1. The Disparity Between Exploration and Embedded Workflow
Early telemetry spikes often reflect novelty rather than operational integration. When employees first gain access to advanced reasoning models, prompt experimentation is high. Users ask general knowledge questions, paste meeting transcripts for conversational summaries, or test creative writing capabilities. This exploratory phase consumes substantial token volume but rarely alters the core operating cadence of the team. Once the novelty fades, token consumption drops precipitously unless the tool has been integrated into a recurring standard operating procedure.
2. Uneven Value Distribution Across Job Roles
A single data analyst who uses an AI data agent to automate quarterly financial reconciliations creates exponentially more enterprise value than twenty employees who casually summarize email threads. Traditional administrative metrics that weight every user equally fail to capture this value skew. Tracking raw prompt frequency treats a five-second conversational query identically to a structured multi-turn code refactoring session.
3. The Masking of Silent Friction and Failure Modes
Gross login counts fail to show when users try and fail to accomplish a task. When an employee attempts to query an internal dataset through ChatGPT Work, receives an ungrounded or poorly formatted answer, and immediately abandons the platform to complete the work manually, standard telemetry records an active user session. In reality, that session represents an operational failure and an adoption barrier that requires administrative remediation.
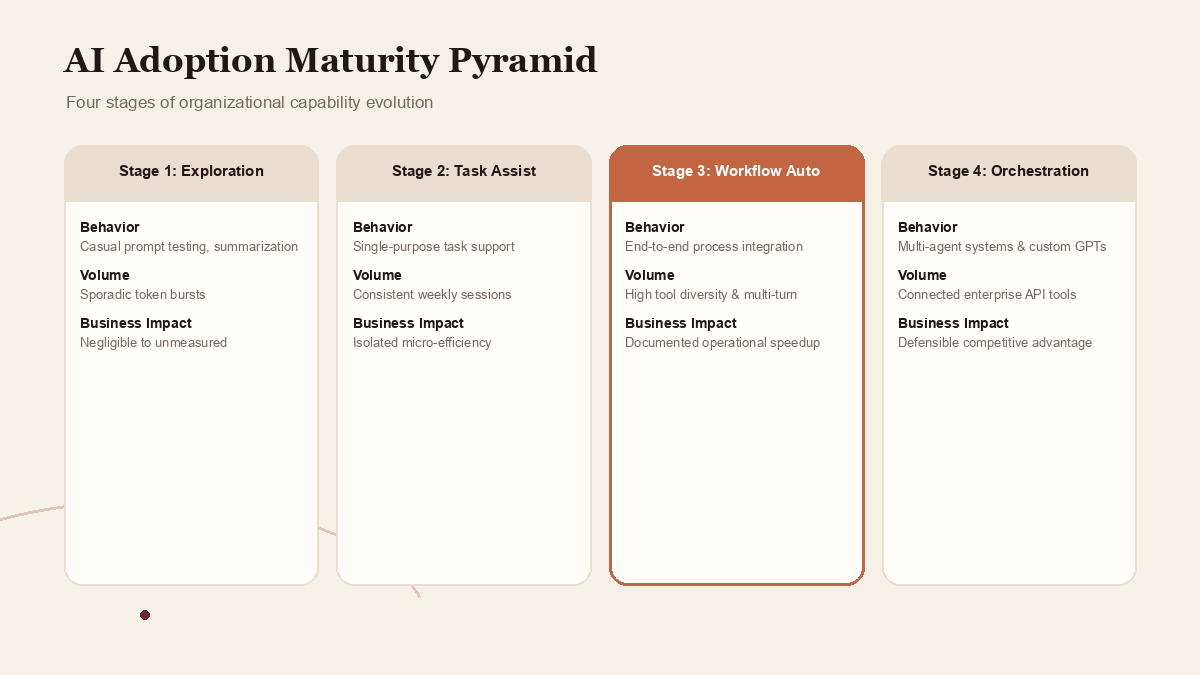
To move beyond the vanity trap, operations teams must establish a diagnostic hierarchy that categorizes user behaviors into four distinct maturity levels: exploratory usage, occasional task assistance, recurring workflow automation, and systematic multi-agent orchestration.
 View image detail
Core Architectural Components of OpenAI Admin Analytics
Administering an enterprise deployment requires understanding what administrative telemetry tracks, how data is aggregated, and where privacy boundaries exist. OpenAI Admin Analytics is designed to provide operational transparency while maintaining employee privacy and compliance safeguards.
Workspace Telemetry and User Segmentation
The administrative console aggregates usage across defined workspace boundaries. Organizations can segment telemetry by:
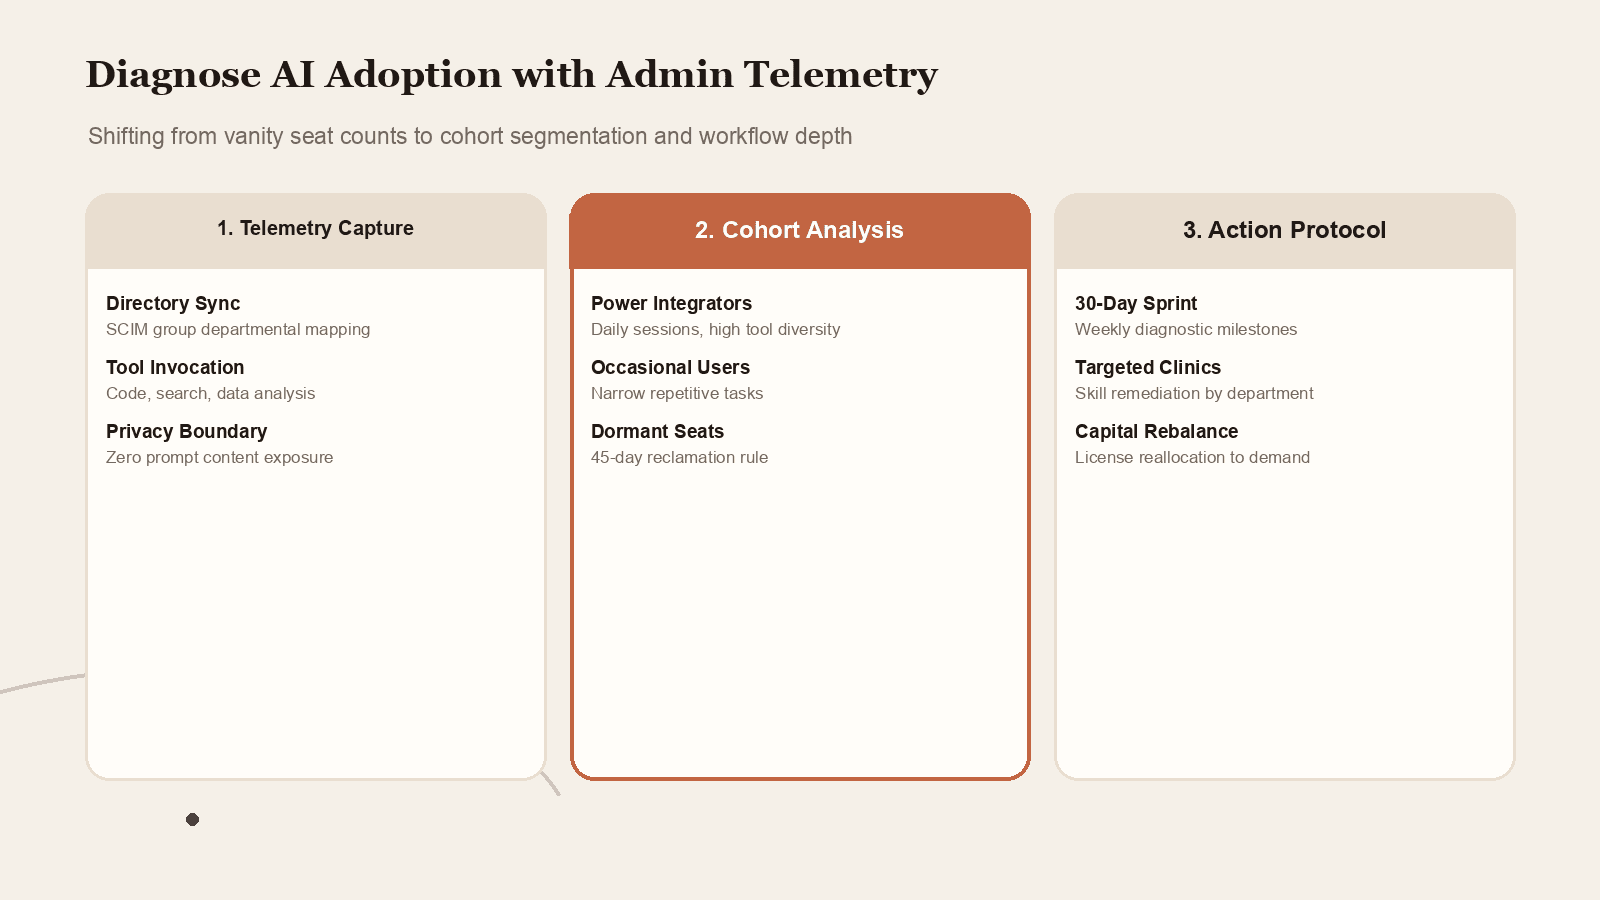
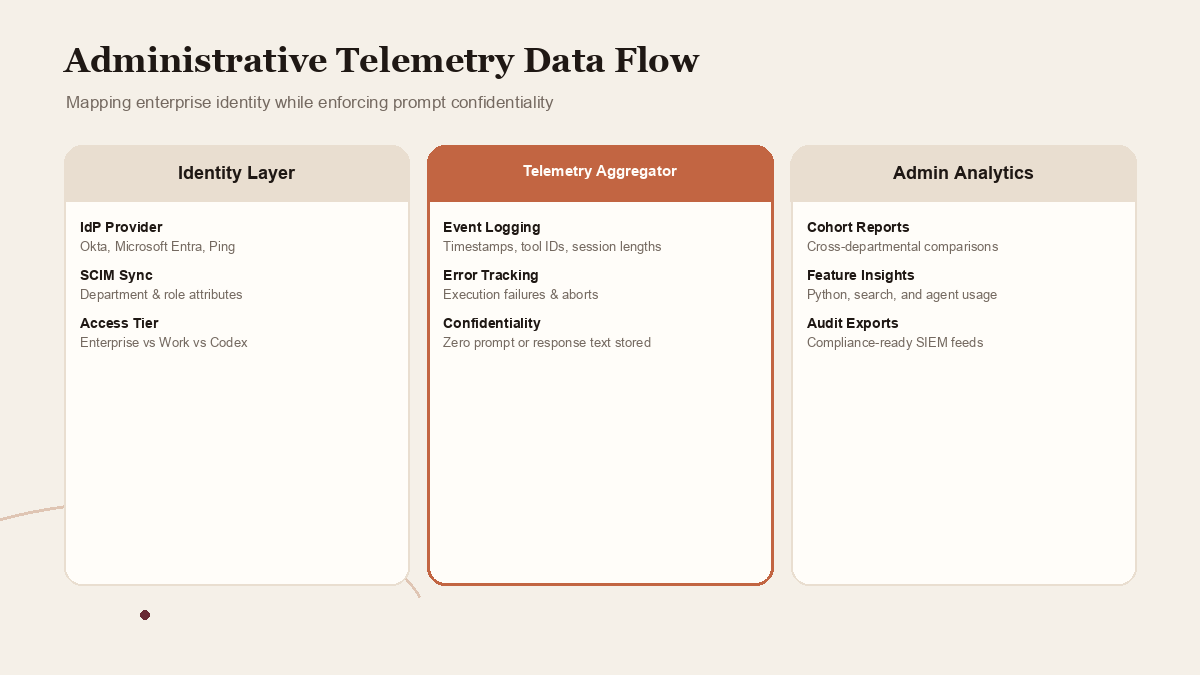
- Departmental Cohorts: Mapping workspace activity to corporate identity providers (such as Okta, Microsoft Entra ID, or Ping Identity) via SCIM group provisioning. This enables comparative analysis between engineering, marketing, finance, customer support, and legal operations.
- Seat Tier Classification: Distinguishing between ChatGPT Enterprise power users, standard business seats, and dedicated Codex developer licenses.
- Access Channels: Monitoring whether interactions originate through the native desktop client, mobile application, web browser interface, or direct first-party API connectors.
Tool and Feature Telemetry
Beyond conversational prompts, modern enterprise workspaces incorporate specialized capabilities. Telemetry tracks:
- Code Interpreter and Data Analysis: Frequency and duration of advanced data computation sessions, Python code execution runs, statistical model simulations, and automated chart rendering.
- Connected Apps and Plugins: Invocation counts for enterprise connectors, Model Context Protocol (MCP) integrations, internal document repositories, and external database endpoints.
- Custom Workspace Agents: Utilization rates for internally published custom GPTs, team project workspaces, shared instruction sets, and collaborative prompt repositories.
Privacy and Confidentiality Boundaries
A critical governance feature of OpenAI Admin Analytics is the strict boundary between metadata telemetry and prompt content. Administrators can inspect aggregate volume, execution timestamps, error codes, and tool invocation types. However, administrators cannot inspect the raw text of individual employee prompts or generated responses without explicit, legally governed audit configurations. Maintaining this boundary is essential for fostering employee psychological safety and preventing chilling effects on adoption.
 View image detail
The Four Diagnostic Cohorts: Segmenting Your User Base
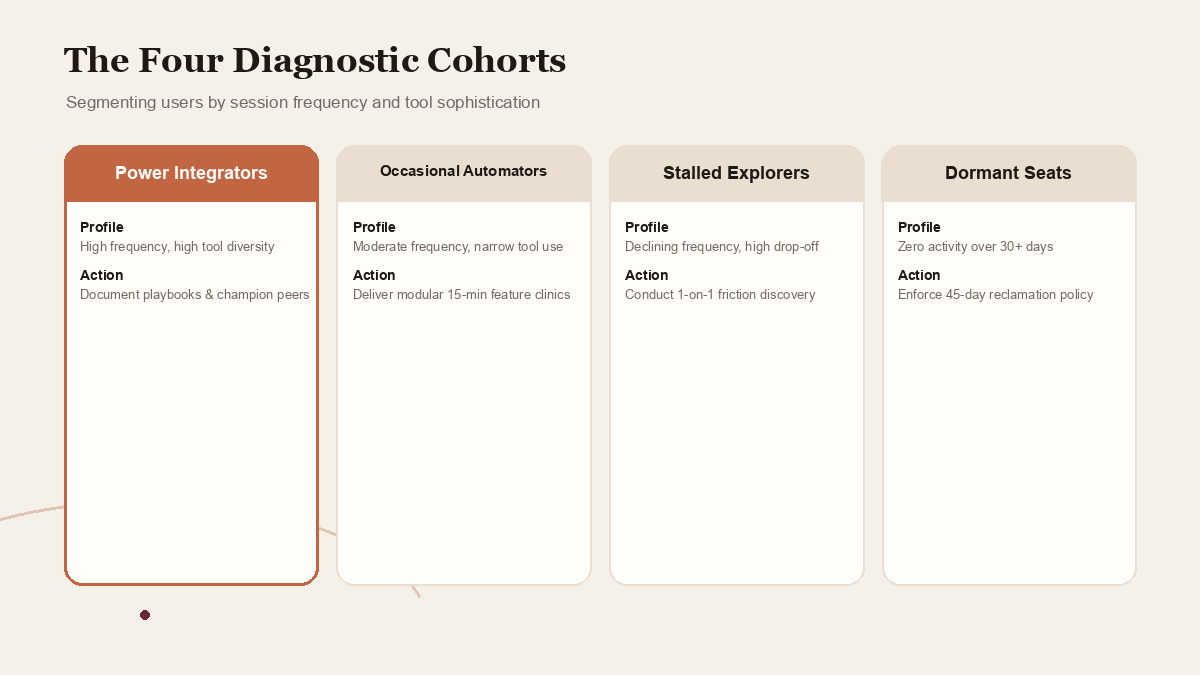
To turn telemetry into actionable operational strategy, organizations must categorize provisioned seats into four actionable behavioral cohorts. Evaluating telemetry on a cohort basis reveals exactly where enablement resources should be directed.
Cohort 1: Power Integrators (High Volume, High Tool Diversity)
Power integrators represent the vanguard of organizational adoption. These users exhibit high daily or weekly session frequency combined with broad tool utilization. They routinely invoke code interpretation, connect custom workspace agents, utilize structured reasoning modes, and share project templates with colleagues.
- Diagnostic Signal: Regular session cadences, high ratio of tool invocations per prompt, consistent utilization of advanced models, and sustained retention across multiple months.
- Management Strategy: Study their workflows to identify scalable best practices. Recruit power integrators as internal departmental champions and task them with authoring standardized prompt templates and custom GPTs for their peers.
Cohort 2: Occasional Automators (Moderate Volume, Narrow Tool Use)
Occasional automators have found one or two specific tasks where AI delivers reliable value, but they have not expanded their usage into other operational areas. A copywriter might use the model exclusively for headline generation, or a financial analyst might use it solely for formatting raw CSV tables.
- Diagnostic Signal: Moderate monthly active days, highly repetitive prompt structures, low tool diversity, and zero utilization of connected enterprise apps.
- Management Strategy: Provide targeted, modular enablement. Rather than broad introductory webinars, offer focused 15-minute clinics demonstrating adjacent capabilities, such as automated formula validation or multi-document comparative synthesis.
Cohort 3: Stalled Explorers (Declining Volume, High Abandonment)
Stalled explorers represent the greatest immediate risk to ROI. These users were active during the initial rollout but experienced a sharp drop in session frequency after three to six weeks. In many cases, these employees attempted complex tasks, encountered hallucinations or formatting limitations, concluded the technology was unreliable, and reverted to legacy manual habits.
- Diagnostic Signal: Steep downward slope in 30-day rolling activity, elevated prompt abort rates, and a complete absence of saved project workspaces.
- Management Strategy: Conduct structured user interviews. Stalled explorers rarely report their frustrations proactively; they simply stop opening the application. Pinpoint the specific operational bottlenecks that caused disillusionment and provide calibrated, step-by-step guidance on prompt framing and output verification.
Cohort 4: Dormant Seats (Zero or Near-Zero Activity)
Dormant seats represent pure procurement waste. These employees received provisioned licenses during initial onboarding but have logged in fewer than three times over a 60-day window.
- Diagnostic Signal: Zero sessions logged in the preceding 30 days, zero tool invocations, and unread onboarding invitations.
- Management Strategy: Implement an automated license reclamation rule. If a provisioned seat remains dormant for 45 consecutive days without an approved operational justification, the license is automatically reclaimed and returned to the procurement pool for reallocation to high-demand departments.
 View image detail
Designing an Actionable 30-Day Diagnostic Sprint
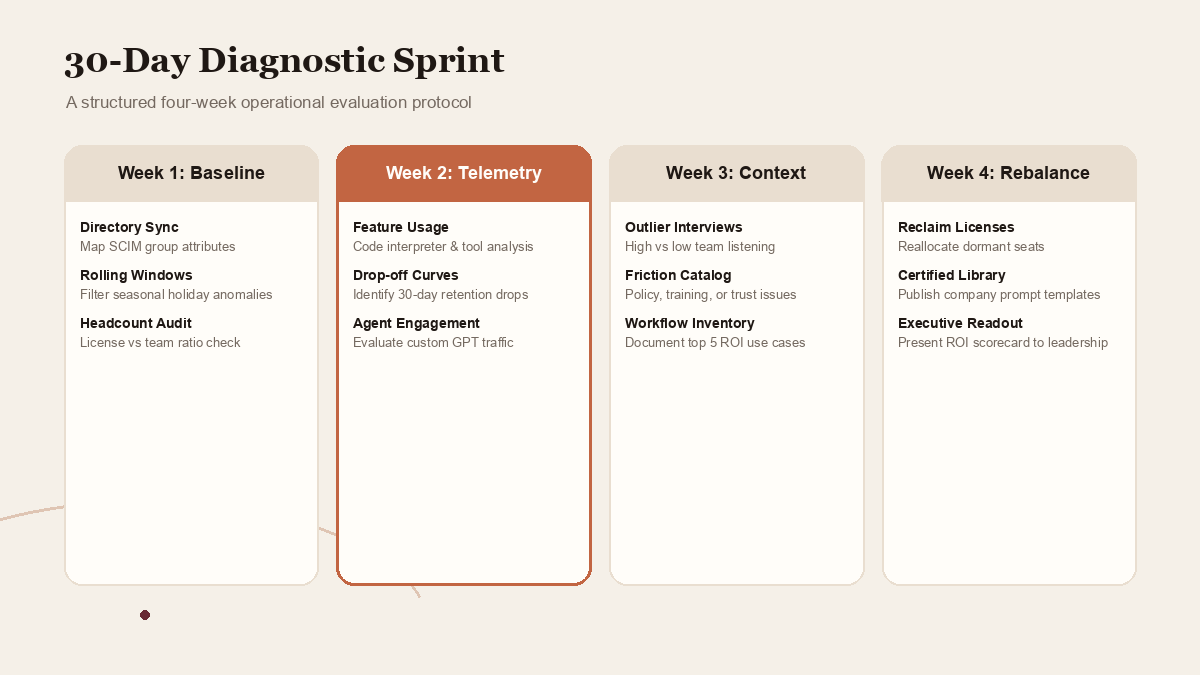
Rather than reviewing analytics sporadically, operations teams should execute a structured 30-day diagnostic sprint. This sprint transforms raw administrative telemetry into a validated operational roadmap.
Week 1: Identity Clean-Up and Baseline Auditing
The first week establishes measurement integrity across the corporate directory:
- Synchronize SCIM Group Attributes: Ensure all enterprise users are properly mapped to departmental units, functional roles, and geographic regions. Unassigned users distort cohort averages.
- Establish Rolling Baseline Windows: Define standard reporting periods (such as 30-day rolling averages) to filter out seasonal anomalies, public holidays, or corporate offsite disruptions.
- Audit License Distribution vs Headcount: Calculate the exact ratio of provisioned licenses to department headcounts. Identify functional groups with excess allocations or waitlisted employees.
- Catalog Existing Workspace Assets: Identify all custom GPTs and shared workspaces currently active to establish an inventory of existing employee-created tools.
Week 2: Behavioral Funnel and Tool Utilization Analysis
The second week drills into specific capability adoption patterns:
- Evaluate Advanced Feature Adoption: Calculate the percentage of total workspace users who actively utilize advanced data analysis, web browsing, or custom workspace agents.
- Benchmark Custom GPT Engagement: Determine which internal agents are driving recurring organizational traffic and which are abandoned single-use experiments.
- Map Drop-Off Curves: Analyze user retention curves from day 1 to day 30 post-provisioning to identify the precise moment where drop-off occurs.
- Examine Peak Usage Cadence: Review hourly and daily usage patterns to evaluate whether employees treat the tool as an episodic search engine or an integrated work companion.
Week 3: Departmental Deep Dives and Qualitative Alignment
Data alone cannot explain employee motivation. Week three pairs telemetry with targeted human context:
- Host Listening Sessions with Outlier Teams: Schedule 30-minute qualitative interviews with the highest-performing department and the lowest-performing department.
- Identify Policy and Cultural Barriers: Investigate whether low adoption stems from technical friction, lack of training, or unaddressed managerial anxiety regarding data confidentiality.
- Catalog High-ROI Workflows: Document the top five validated use cases currently delivering quantifiable time savings within the organization.
- Audit Knowledge Gaps: Identify whether employees understand how to ground model responses in enterprise documents or if they struggle with hallucination management.
Week 4: Governance Policy Rebalancing and License Reallocation
The final week executes operational adjustments based on sprint findings:
- Execute License Reclamation: Reclaim inactive licenses from Cohort 4 and allocate them to departments with waiting lists or verified high-leverage pilot projects.
- Publish Standardized Template Libraries: Elevate the workflows discovered in Cohort 1 into enterprise-wide certified prompts and workspace templates.
- Schedule Targeted Enablement Clinics: Launch specific skill-building workshops tailored to the workflow gaps identified in Cohort 2 and Cohort 3.
- Deliver Executive Readout: Present the consolidated findings and reallocation metrics to executive sponsors.
 View image detail
Reallocating Capital: The License Optimization Protocol
Software licensing budgets are finite. When enterprise licenses cost hundreds of dollars per user annually, maintaining unutilized seats directly erodes the business case for generative AI investments. A disciplined license optimization protocol ensures that capital flows continuously toward productive users.
The 45-Day Inactivity Rule
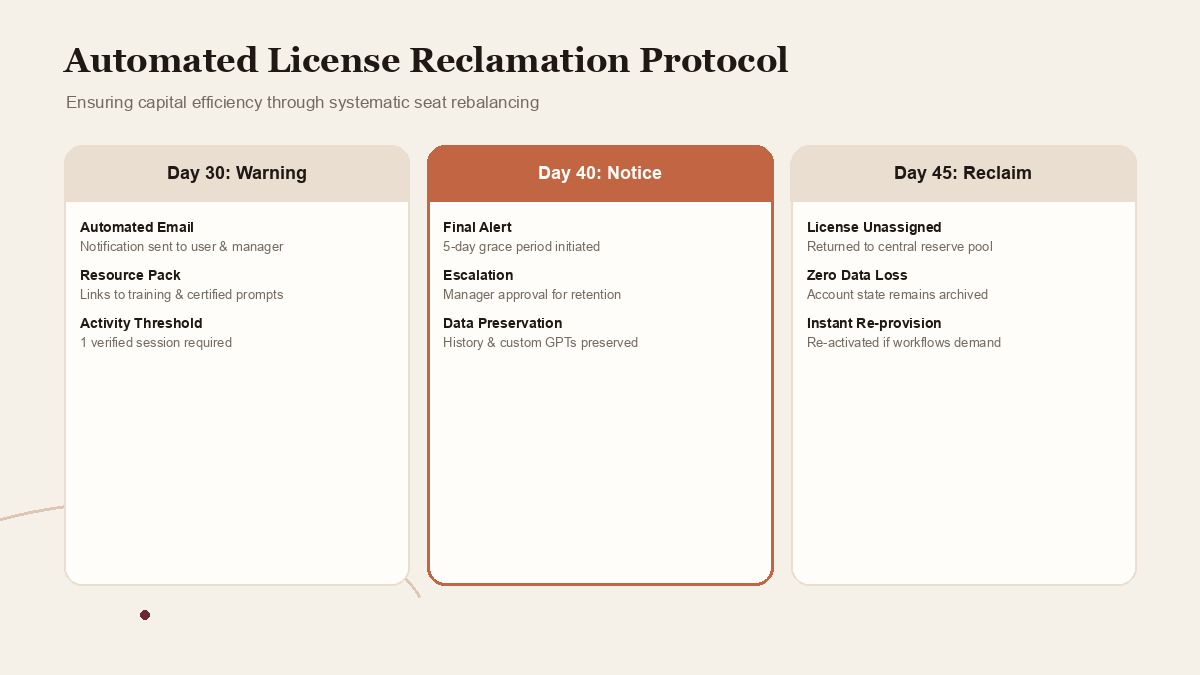
Organizations should codify a transparent, automated license management policy:
- Day 30 Inactivity Warning: An automated notification is sent to the employee and their direct supervisor noting that the license has not been utilized for 30 days. The notification includes links to introductory enablement clinics and certified template libraries.
- Day 40 Final Notice: A secondary notification confirms that the seat will be transitioned to a shared or basic tier within five business days unless active business utilization is logged.
- Day 45 Automatic Revocation: The license is unassigned and returned to the central reserve pool. The employee retains their account history and project data, ensuring that if their workflow demands change in the future, the seat can be re-provisioned instantly.
Floating License Pools for Intermittent Project Teams
Not all enterprise roles require dedicated, permanent seats. Project managers, seasonal auditors, and cross-functional task forces often experience intense, short-term needs for advanced AI tools followed by months of standard operating routines. Establishing a "floating" license pool allows business units to check out enterprise seats for 30-day project sprints without permanently inflating baseline recurring software costs.
Measuring Seat Turnover and Net Adoption Health
To evaluate the success of license rebalancing, track the Net Seat Velocity (NSV):
$$ ext{Net Seat Velocity} = rac{ ext{New Active Power Seats} - ext{Reclaimed Dormant Seats}}{ ext{Total Enterprise Allocation}} imes 100$$
A positive Net Seat Velocity confirms that the organization is actively migrating passive license holders into productive workflow automators, steadily improving capital efficiency.
 View image detail
Designing High-Impact Enablement Clinics Based on Telemetry Data
Generic training sessions titled "Introduction to Generative AI" rarely produce lasting behavioral change. Employees already know how to ask conversational questions. What they lack is the mental model required to translate complex, messy business problems into structured, multi-turn AI interactions.
Telemetry data reveals exactly which operational skills are missing across each department.
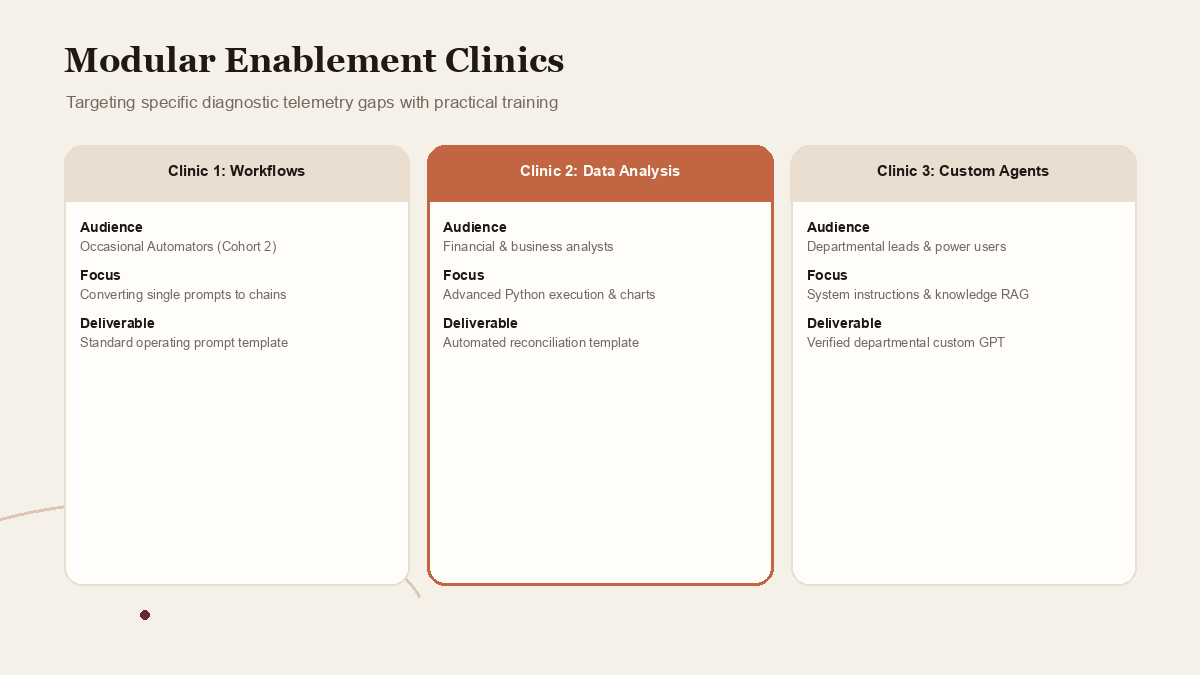
Remediation Clinic 1: From Prompts to Structured Workflows
Targeted at Cohort 2 (Occasional Automators), this clinic focuses on converting single-shot queries into reproducible operating procedures.
- Curriculum: Breaking down complex analytical tasks into sequential stages: ingestion, structural parsing, draft synthesis, edge-case validation, and executive formatting.
- Concrete Deliverable: Each participant leaves the workshop with a documented, reusable prompt chain for their primary weekly deliverable.
Remediation Clinic 2: Advanced Data Analysis for Non-Programmers
Designed for business analysts and operations managers who underutilize the Python-based data analysis engine in ChatGPT Work.
- Curriculum: Securely uploading multi-tab spreadsheets, instructing the model to clean messy data structures, generating statistical distribution models, and exporting production-ready charts.
- Concrete Deliverable: An automated reconciliation template that reduces a routine four-hour spreadsheet audit to a five-minute supervised run.
Remediation Clinic 3: Building and Auditing Custom Departmental Agents
Targeted at departmental leaders and power integrators looking to scale their expertise across their broader business unit.
- Curriculum: Configuring custom GPT system instructions, establishing deterministic output formatting, uploading static knowledge bases, and applying verification rubrics to prevent hallucinations.
- Concrete Deliverable: A fully functioning departmental agent deployed to the internal workspace directory with verified permission boundaries.
 View image detail
Building an Executive Dashboard for Continuous Governance
Administrative diagnostics must not remain trapped in technical management consoles. Executive sponsors require a clean, balanced scorecard that communicates deployment health, security compliance, and organizational momentum at a glance.
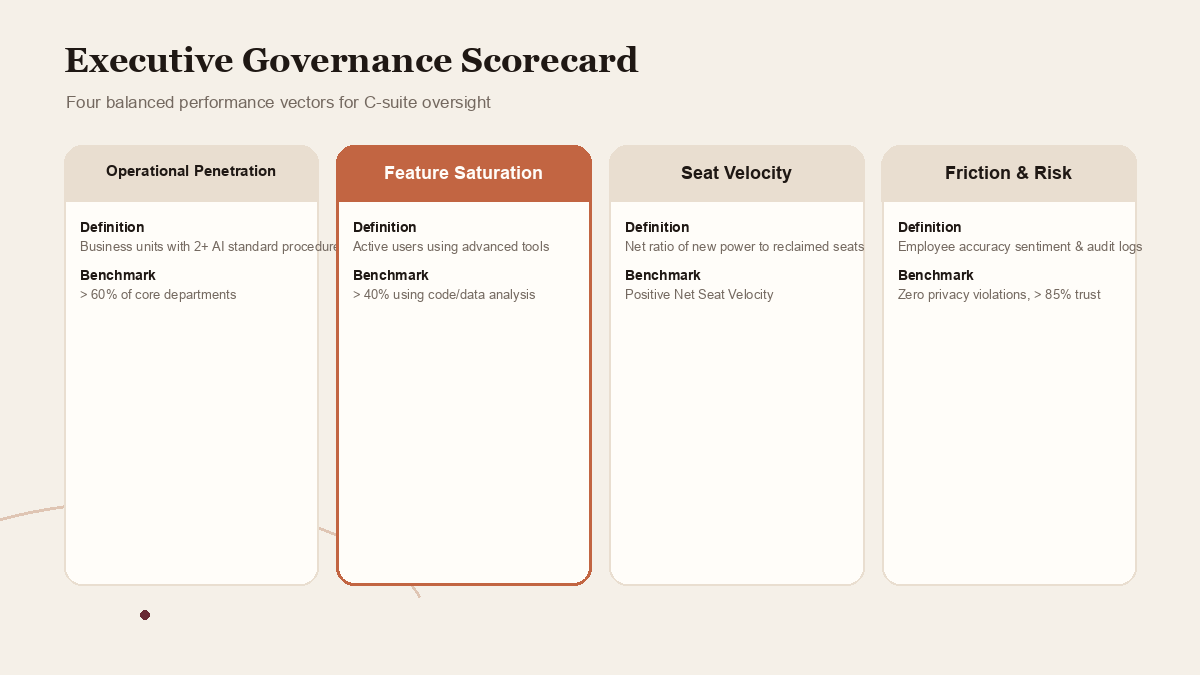
A complete executive scorecard tracks four primary performance vectors:
1. The Operational Penetration Ratio
The proportion of provisioned business units that have successfully integrated AI into at least two documented standard operating procedures. This metric prevents executive leadership from mistaking wide, shallow seat adoption for deep organizational integration.
2. Advanced Feature Saturation Rate
The percentage of active users who regularly utilize capabilities beyond conversational text: code interpretation, file manipulation, custom GPTs, and connected enterprise data tools. Saturation rates above 40 percent typically correlate with durable productivity gains.
3. Seat Velocity and Capital Efficiency
A continuous metric tracking license utilization rates, automated reclamation volume, and the cost-per-active-workflow ratio across each division.
4. Qualitative Friction and Risk Sentiment
Quarterly internal sentiment surveys tracking employee confidence, perceived accuracy, output verification time, and operational trust in AI-assisted deliverables.
By reviewing this balanced scorecard monthly, executive steering committees can make informed resource allocation decisions, sponsor cross-functional automation sprints, and ensure that their enterprise AI deployment evolves into a defensible competitive advantage.
 View image detail
Avoiding Five Common Diagnostic Pitfalls
When enterprise teams begin analyzing administrative telemetry, they often encounter analytical pitfalls that lead to misguided interventions. Recognizing these failure patterns ensures that leadership interprets data with nuance:
Pitfall 1: Penalizing Low-Frequency, High-Value Specialists
Certain corporate specialists, such as senior intellectual property attorneys or principal software architects, may only invoke AI tools two or three times a month. However, each session might involve analyzing a complex 200-page patent filing or refactoring a critical distributed architecture. De-provisioning their seats based solely on low session counts destroys disproportionate value. Telemetry must be cross-referenced with role seniority and task criticality before executing automated reclamation.
Pitfall 2: Over-Indexing on Prompt Length
Some administrators assume that longer prompts correlate with higher sophistication. In practice, seasoned power integrators often write concise, highly modular instructions that leverage custom instructions, uploaded reference schemas, and system prompt constraints. Conversely, struggling users often paste massive, disorganized blocks of unstructured text. Analyze tool invocation depth and multi-turn refinement rather than raw character counts.
Pitfall 3: Ignoring Negative Verification Loops
When employees spend excessive time in back-and-forth prompt loops trying to correct a model error, telemetry records intense, engaged session activity. An inexperienced analyst might interpret this as high engagement. In reality, protracted conversational looping often signals that the model is ill-suited for the task or lacks necessary context documents. Monitoring prompt-to-resolution ratios helps identify workflows requiring pre-engineered templates.
Pitfall 4: Treating Enablement as a One-Time Milestone
Conducting an initial onboarding webinar during week one and never offering follow-up instruction is a proven path to adoption stagnation. Enterprise technology landscapes shift rapidly as new frontier models, tools, and connectors are deployed. High-performing organizations treat enablement as an ongoing operational discipline, hosting bi-weekly office hours and maintaining active peer-support channels.
Pitfall 5: Failing to Close the Feedback Loop with Product Teams
When telemetry reveals that an entire department consistently avoids a newly released feature, administrators must investigate whether the issue is organizational or technical. If marketing teams avoid a data analysis tool because corporate firewalls block required CSV exports, no amount of prompt coaching will resolve the bottleneck. Operations teams must maintain active communication with internal IT infrastructure teams to eliminate technical barriers.
Conclusion: Turning Telemetry into Sustained Advantage
Generative AI adoption is not an IT installation; it is an organizational capability that requires continuous diagnosis, coaching, and optimization. Relying on superficial login metrics or vendor-supplied marketing benchmarks leaves enterprise leaders blind to the true operational state of their teams.
By leveraging OpenAI Admin Analytics through a structured diagnostic framework, organizations can replace guesswork with empirical clarity. Segmenting users into actionable cohorts allows leaders to support struggling teams, liberate wasted capital from dormant seats, and scale the breakthroughs of internal power users across the entire enterprise. The organizations that master this operational discipline will not merely adopt AI; they will systematically compound its value across every facet of their business.
Sources
- OpenAI Official Documentation: How to Connect AI Usage to Business Value
- National Institute of Standards and Technology (NIST) CAISI Research: Accelerating AI Innovation Through Measurement Science
Checked for this article
Sources
Keep going
Related notes.
Automation and Agents
How to Implement MCP Events in ChatGPT: Event-Triggered Automations
Autonomous conversational agents no longer need to rely on wasteful polling loops. Here is how to implement event-triggered automations using ChatGPT MCP Events.
Read the article
Automation and Agents
How to Build Recurring Web Automations with Perplexity Computer
Web scraping scripts break whenever a layout shifts. Here is how to build durable, recurring web automations using Perplexity Computer and persistent state.
Read the article
Automation and Agents
How to Benchmark Classifier Models: Latency, Cost, Determinism
Evaluating AI classifiers requires looking beyond static accuracy. Here is how to benchmark probability calibration, latency percentiles, and unit economics.
Read the article