
Automation and Agents
How to Measure Generative AI Business ROI Beyond Vendor Formulas
Vendor ROI formulas rely on theoretical hours saved. Here is how to calculate true net economic returns using empirical measurement science.
On this page
- The Structural Flaws in Vendor ROI Calculators
- 1. The Fallacy of the Fungible Hour
- 2. The Erasure of Verification and Rework Overhead
- 3. The Substitution of Activity for Output
- The Four Pillars of Empirical AI Measurement Science
- Pillar 1: Pre-Deployment Baseline Rigor
- Pillar 2: Controlled Blind and Matched Cohort Trials
- Pillar 3: Downstream Defect and Quality Tracking
- Pillar 4: Hard Dollar Accounting Rules
- Building the True Net Value Formula
- 1. Productive Output ($\Delta ext{Output} imes ext{Unit Value}$)
- 2. Direct Tool Costs
- 3. Verification Labor
- 4. Rework Costs
- 5. Enablement Overhead
- Human-in-the-Loop Verification Benchmarks Across Professional Domains
- Software Engineering and Code Review
- Legal and Compliance Analysis
- Financial Modeling and Audit Reconciliation
- Customer Operations and Technical Support
- Case Study Comparison: Customer Operations Deployment
- The Vendor Calculator View
- The Empirical Measurement View
- The Net Economic Calculation
- Designing an Audit-Ready ROI Dashboard for the Boardroom
- Quadrant 1: Hard Financial Realization
- Quadrant 2: Operational Velocity and Throughput
- Quadrant 3: Quality and Risk Governance
- Quadrant 4: Capital Allocation and Efficiency
- Opportunity Cost and Human Capital Reinvestment
- Establishing Governance Guardrails to Protect Realized Value
- Guardrail 1: The Principle of Verification Parity
- Guardrail 2: Continuous Baseline Recalibration
- Guardrail 3: Mandated Capital Rebalancing Triggers
- Conclusion: Strategic Clarity in the Age of Generative AI
- Sources
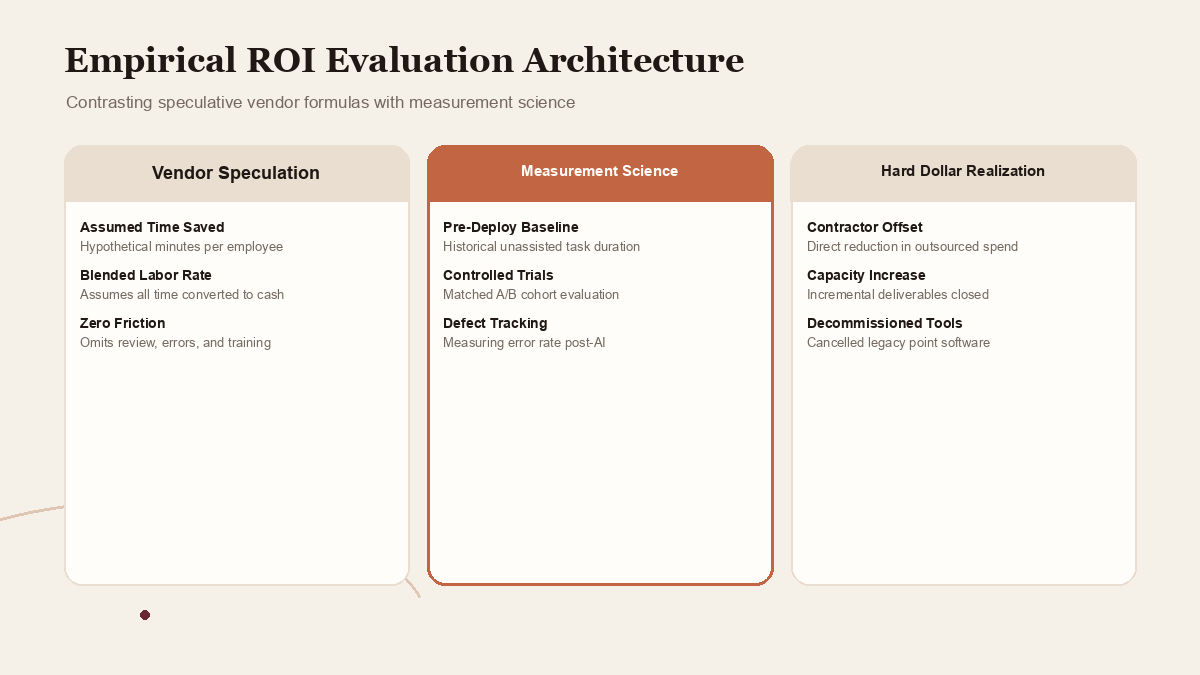
As generative AI transitions from experimental enterprise pilots to multi-million-dollar software commitments, boardrooms and executive committees are demanding financial accountability. Chief financial officers and technology leaders face a challenging mandate: quantify the exact return on investment (ROI) generated by conversational agents, code assistants, and enterprise language models. In response, vendors and industry analysts routinely offer simplified value calculators. These formulas multiply provisioned seats by an estimated number of hours saved per week, multiply that sum by an average blended hourly labor rate, and present an astonishing return figure, often exceeding 200 to 300 percent within the first year.
In the real world of enterprise operations, these simplistic calculations collapse under scrutiny. They treat hypothetical time saved as liquid cash, ignore the hidden friction of verification and rework, and mistake tool activity for commercial productivity. When an employee saves twenty minutes drafting an email or summarizing a document, that time rarely converts directly into added revenue or reduced operating expense. Instead, it is frequently absorbed by meeting creep, casual exploration, or additional internal communication.
Building an authentic, audit-ready ROI model requires grounding evaluation in measurement science rather than marketing projections. Guided by empirical frameworks from the National Institute of Standards and Technology (NIST) and operational measurement methodologies, organizations must establish pre-deployment baselines, account for downstream verification costs, and tie AI deployment directly to business outcome metrics.
This article provides a rigorous, CFO-grade methodology for measuring the true economic impact of generative AI. By dismantling speculative vendor formulas and replacing them with empirical measurement protocols, finance and operations leaders can make disciplined, defensible investment decisions.
 View image detail
The Structural Flaws in Vendor ROI Calculators
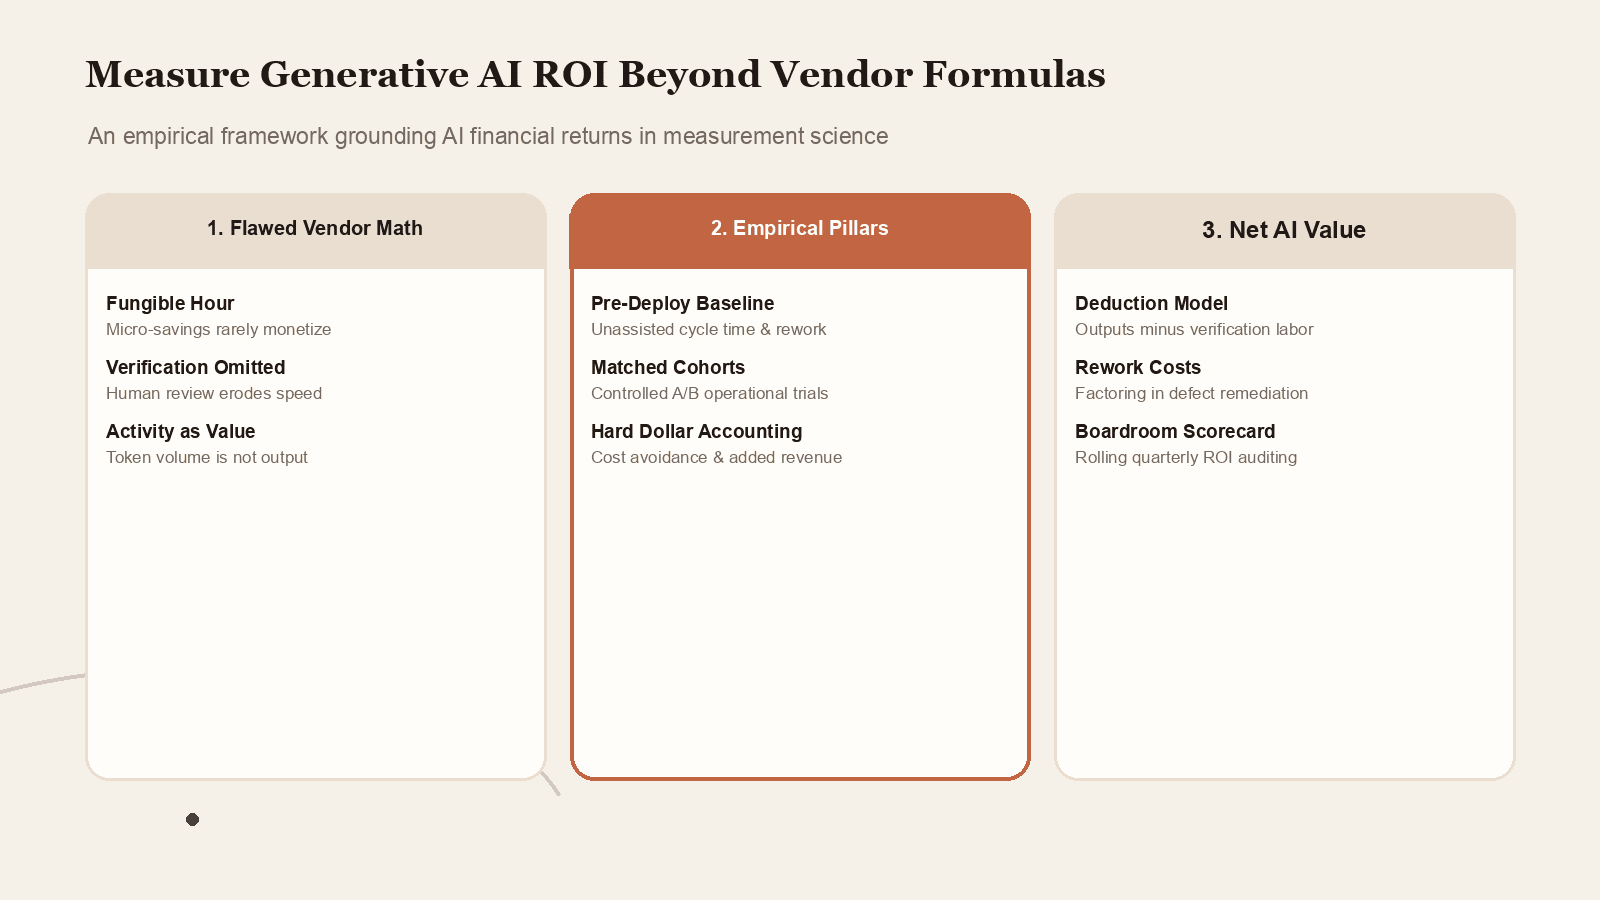
To understand why vendor formulas fail, financial leaders must dissect the core assumptions baked into traditional software value calculators. These models rely on three fundamental fallacies:
1. The Fallacy of the Fungible Hour
Vendor calculators assume that if an employee saves 15 minutes on a reporting task, those 15 minutes are fully recaptured by the organization as productive labor. Economists have long recognized that cognitive work does not operate on a linear production line. Saved micro-increments of time are notoriously difficult to consolidate into meaningful, higher-value work. Unless an automation initiative removes an entire contiguous block of labor that can be explicitly reallocated to billable client work, new product development, or documented administrative reduction, the financial value of "time saved" remains theoretical.
2. The Erasure of Verification and Rework Overhead
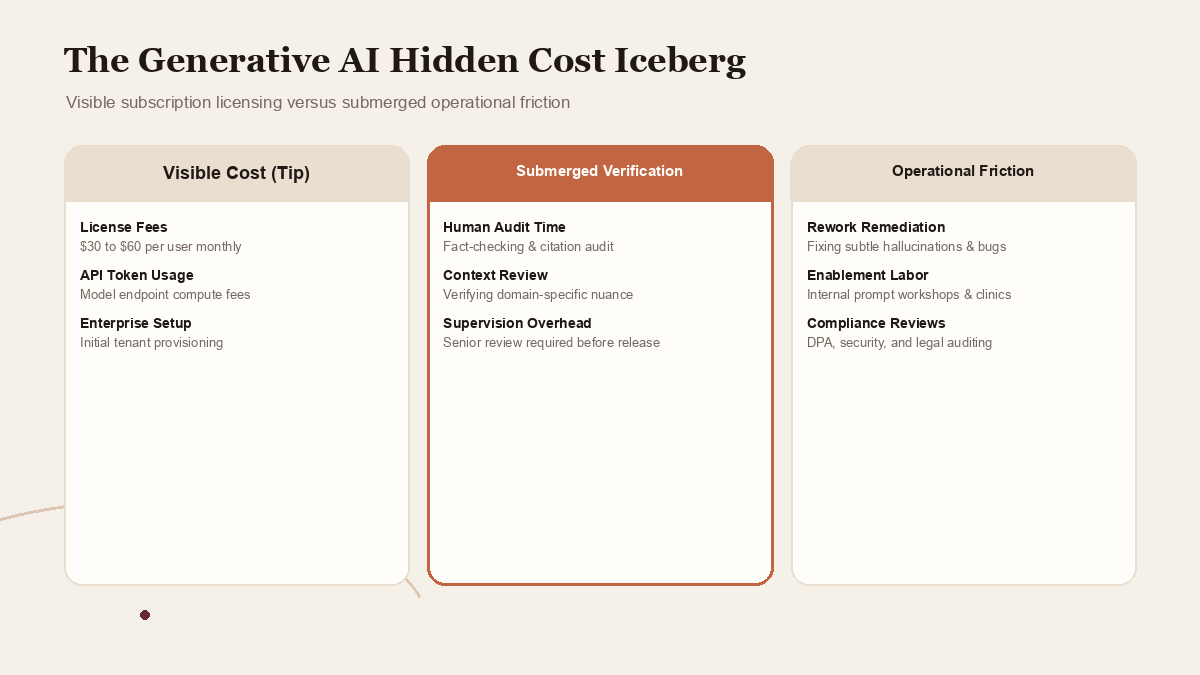
Generative language models are probabilistic reasoning engines, not deterministic calculation tools. Every draft, code block, or synthesis produced by an AI assistant carries an inherent risk of hallucination, omission, or subtle context drift. Consequently, responsible professional workflows mandate human review.
Vendor models celebrate the fact that an initial draft can be generated in two minutes instead of forty. What they omit from the ledger is the twenty minutes the human specialist must subsequently spend verifying statutory citations, checking numerical tables against source ledgers, and correcting stylistic inconsistencies. In high-stakes domains like legal, compliance, engineering, and finance, verification overhead can easily erode the initial speed advantage.
3. The Substitution of Activity for Output
Vendor dashboards report tokens processed, prompts executed, and active daily users. Marketing models then equate these activity metrics with productivity. However, measurement science establishes a sharp boundary between utilization and value. An engineering team that generates 50,000 lines of AI-assisted boilerplate code has not created five times more value than a team that crafts 10,000 lines of highly optimized, bug-free architectural logic. In fact, if the auto-generated code introduces subtle security vulnerabilities or architectural debt, it represents negative net value.
 View image detail
The Four Pillars of Empirical AI Measurement Science
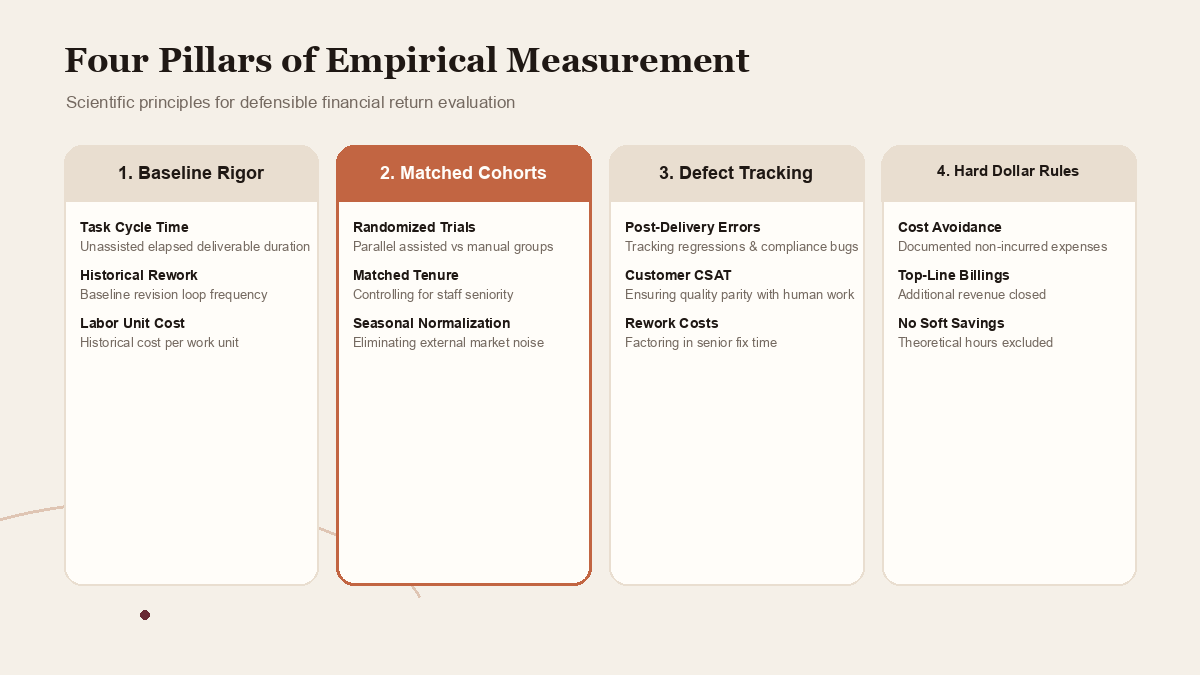
To escape speculative modeling, organizations must adopt an empirical measurement framework. Grounded in the principles outlined by NIST's Artificial Intelligence Safety Institute and measurement science researchers, true ROI evaluation rests on four foundational pillars:
Pillar 1: Pre-Deployment Baseline Rigor
An organization cannot measure acceleration without first establishing an accurate baseline of unassisted velocity. Prior to provisioning tools like ChatGPT Enterprise or Codex across a department, operations leaders must benchmark:
- Task Cycle Time: The total elapsed time required to take a standard business deliverable from initial intake to final sign-off.
- Rework Frequency: The percentage of submitted deliverables that fail initial quality review and require revision loops.
- Historical Unit Cost: The fully loaded human labor cost required to produce a standardized unit of work (such as an audited financial brief, a pull request, or a customer resolution ticket).
- Baseline Error Rate: The historical frequency of factual errors, code bugs, or compliance deviations under purely manual workflows.
Pillar 2: Controlled Blind and Matched Cohort Trials
The gold standard of measurement science is the randomized controlled trial. When evaluating enterprise AI impact, organizations should select matched cohorts within the same functional division.
For example, a customer operations department with sixty support engineers can divide staff into two balanced groups matched for tenure, historical resolution speed, and ticket complexity. The control group continues utilizing standard knowledge bases and manual workflows, while the pilot group utilizes AI-assisted drafting and retrieval agents. Tracking both cohorts over an eight-week testing window eliminates external market noise and seasonal distortions.
Pillar 3: Downstream Defect and Quality Tracking
Speed without quality is an operational liability. Measurement protocols must track quality metrics in parallel with cycle times. If an engineering team increases pull request velocity by 35 percent but post-deployment defect rates rise by 15 percent, the net economic impact is negative due to emergency hotfixes, customer disruption, and engineering burnout. Quality scoring rubrics must evaluate factual accuracy, structural completeness, adherence to corporate style guidelines, and compliance with data privacy regulations.
Pillar 4: Hard Dollar Accounting Rules
For financial audits, CFOs recognize only three categories of economic value:
- Direct Cost Avoidance: Documented expenses that the company will not incur due to the deployment (such as reduced external contractor spend, lowered third-party translation fees, or decommissioned legacy software licenses).
- Incremental Revenue Generation: Additional top-line billings or closed contracts directly attributable to increased team capacity (such as an agency taking on two additional client retainers without expanding headcount).
- Structured Headcount Rebalancing: Documented reassignment of existing personnel from low-value manual processing to verified, revenue-generating initiatives.
Speculative "soft savings" based on theoretical minutes saved are relegated to secondary informational notes and are never included in primary ROI calculations.
 View image detail
Building the True Net Value Formula
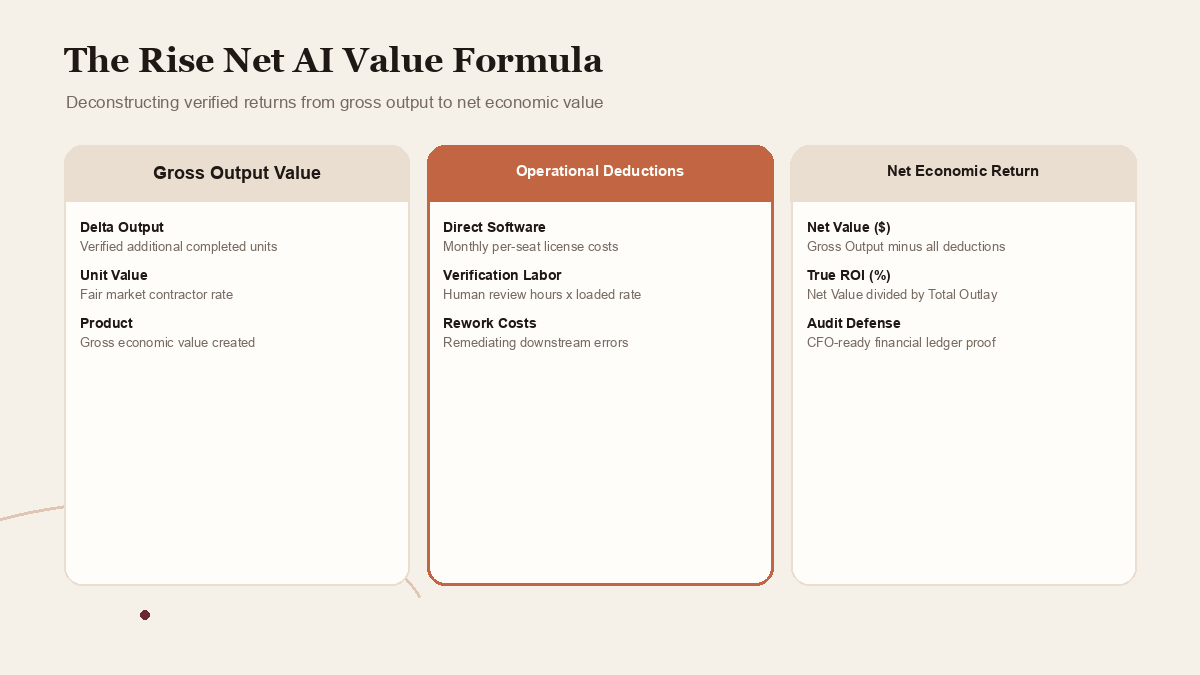
To replace flawed vendor formulas, finance teams can implement the Rise Net AI Value Formula. This equation explicitly subtracts the hidden costs of adoption from gross productivity gains.
$$ ext{Net Economic Value} = (\Delta ext{Productive Output} imes ext{Unit Value}) - ( ext{Direct Tool Costs} + ext{Verification Labor} + ext{Rework Costs} + ext{Enablement Overhead})$$
Let us examine each variable in detail:
1. Productive Output ($\Delta ext{Output} imes ext{Unit Value}$)
This represents the verified increase in completed, billable, or commercially utilized deliverables. In software engineering, this is measured in merged, defect-free pull requests of equivalent complexity. In customer operations, it is measured in first-contact resolutions meeting standard satisfaction benchmarks. In marketing, it is measured in completed, approved campaign packages deployed to production.
2. Direct Tool Costs
The total financial outlay for software access, including:
- Per-seat monthly licensing fees for ChatGPT Enterprise, ChatGPT Work, or Codex.
- API consumption charges for custom model endpoints and embeddings.
- Add-on fees for specialized third-party data connectors or vector database hosting.
3. Verification Labor
The financial value of human time dedicated to auditing, proofreading, testing, and verifying AI-generated output. In knowledge work, this is calculated by multiplying human audit hours by fully loaded hourly compensation. In regulated industries, this verification step is non-negotiable and represents a substantial ongoing operational commitment.
4. Rework Costs
The financial cost of remediating errors, code regressions, or hallucinations that slipped through initial verification. This includes the engineering time required to patch production bugs or the editorial time required to rewrite flawed customer-facing copy.
5. Enablement Overhead
The upfront and amortized operational expenses required to achieve adoption:
- Internal training clinics, prompt engineering workshops, and documentation authoring.
- Administrative IT labor for SCIM provisioning, SSO integration, and security auditing.
- Legal and compliance review fees for data processing agreements and risk assessments.
 View image detail
Human-in-the-Loop Verification Benchmarks Across Professional Domains
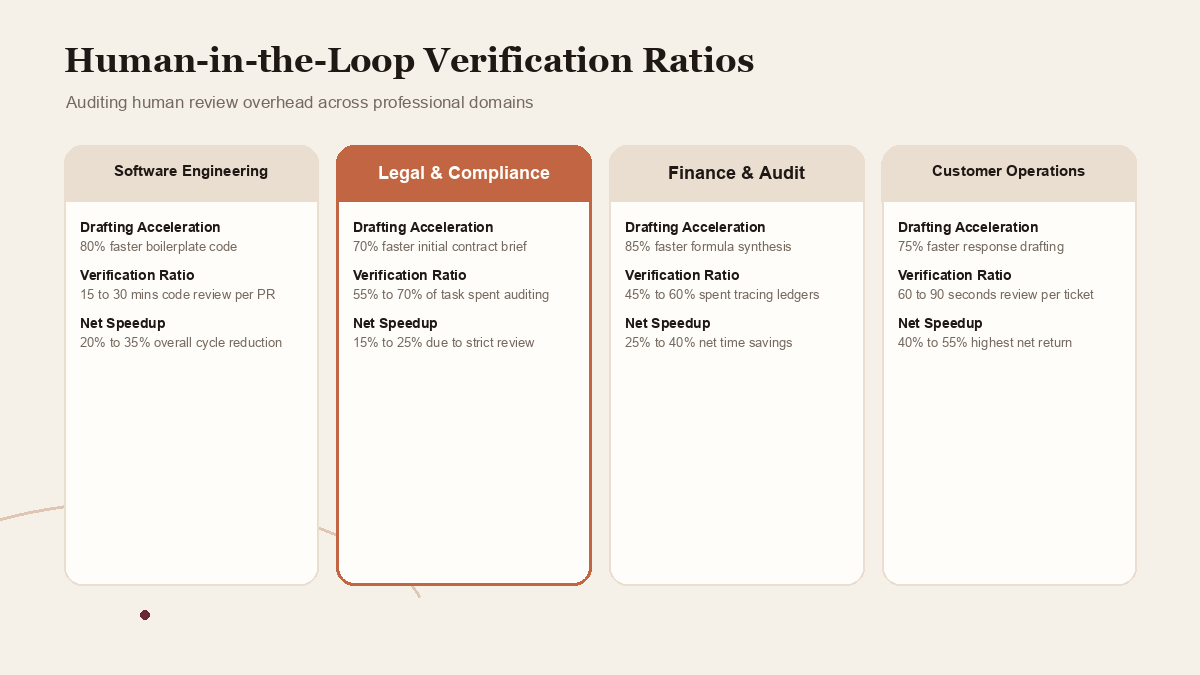
A primary reason vendor calculators overestimate return is that they treat human verification as negligible. In practice, the time required to review, fact-check, and certify an AI-assisted deliverable varies significantly across operational domains.
Software Engineering and Code Review
In software development, generating 200 lines of functional code may take an LLM 15 seconds. However, conducting a rigorous code review, verifying unit test coverage, checking for subtle race conditions, and executing security boundary checks requires between 15 and 30 minutes of senior engineering time. When organizations measure end-to-end pull request cycle times, the initial drafting acceleration accounts for only 20 to 30 percent of total engineering effort.
Legal and Compliance Analysis
In corporate legal practice, drafting an initial non-disclosure agreement or vendor terms summary is dramatically accelerated by frontier models. However, supervising counsel must verify every statutory citation, confirm definition consistency, and ensure ethical wall compliance. Field benchmarks show that verification accounts for 55 to 70 percent of total deliverable duration.
Financial Modeling and Audit Reconciliation
While code interpreter capabilities can generate multi-year revenue projections and complex statistical regressions in seconds, accounting ethics standards require every calculation cell to be traced back to audited general ledgers. Financial verification ratios average 45 to 60 percent of task duration.
Customer Operations and Technical Support
Customer support exhibits the lowest verification friction. A tier-1 support agent can typically review, personalize, and approve an AI-drafted response in 60 to 90 seconds. Consequently, customer support workflows often yield the highest net percentage ROI in initial enterprise rollouts.
 View image detail
Case Study Comparison: Customer Operations Deployment
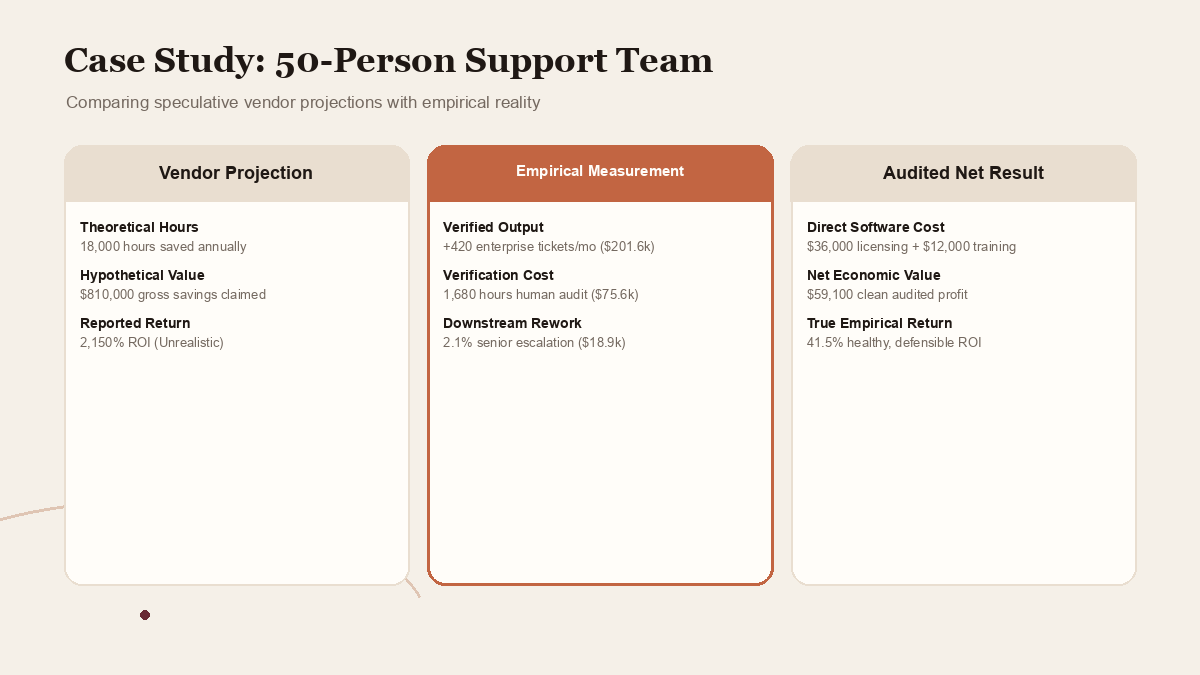
To observe the formula in action, consider a controlled evaluation conducted across a 50-person enterprise customer support department handling complex B2B software inquiries.
The Vendor Calculator View
A standard vendor sales calculator evaluates the deployment as follows:
- Team Size: 50 support specialists.
- Estimated Time Saved: 1.5 hours per employee per day (7.5 hours per week).
- Blended Hourly Rate: $45 per hour fully loaded.
- Annual Hours Saved: $50 imes 7.5 imes 48 ext{ working weeks} = 18,000 ext{ hours}$.
- Gross Theoretical Value: $18,000 imes \$45 = \$810,000$.
- Software Cost: 50 seats at $60 per month = $36,000 annually.
- Reported Vendor ROI: $ rac{\$810,000 - \$36,000}{\$36,000} imes 100 = 2,150\%$.
To any seasoned finance director, a claimed return of 2,150 percent is an immediate red flag indicating unrealistic modeling assumptions.
The Empirical Measurement View
Now, examine the same deployment evaluated through the Rise Net AI Value framework over a 90-day controlled trial with matched cohorts:
- Observed Output Increase: The team resolved an additional 420 complex enterprise tickets per month with identical customer satisfaction scores. Valued at the external contractor replacement rate of $40 per resolution, this generated $201,600 in annualized productive output.
- Direct Tool Costs: $36,000 annual licensing.
- Verification Labor: Specialists spent an average of 4.2 minutes per ticket reviewing AI-drafted responses before sending. Across 24,000 annual tickets, this required 1,680 hours of verification labor, valued at $75,600.
- Rework Costs: In 2.1 percent of interactions, customer escalation occurred due to incomplete AI reasoning, requiring senior tier-3 specialist intervention. Annualized rework cost: $18,900.
- Enablement Overhead: $12,000 for initial administrative integration and role-specific training clinics.
The Net Economic Calculation
$$ ext{Net Economic Value} = \$201,600 - (\$36,000 + \$75,600 + \$18,900 + \$12,000) = \$59,100$$
$$ ext{True Empirical ROI} = rac{\$59,100}{\$142,500 ext{ total investment}} imes 100 = 41.5\%$$
A 41.5 percent net return is a healthy, commercially sound software investment. Crucially, this figure is grounded in real operational data, survives audit scrutiny, and provides executive leadership with a reliable foundation for future capacity planning.
 View image detail
Designing an Audit-Ready ROI Dashboard for the Boardroom
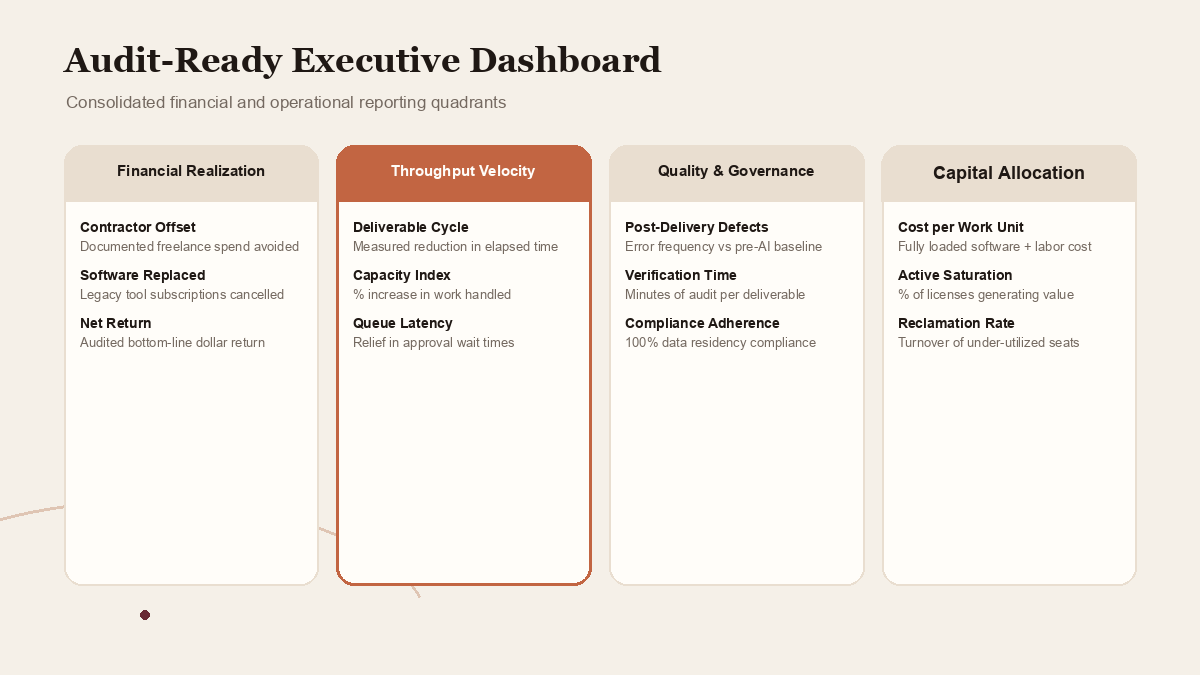
To maintain credibility with executive stakeholders, technology and operational leaders must present financial findings through an audit-ready dashboard. Rather than relying on static annual reviews, top-tier organizations implement rolling quarterly scorecards.
The scorecard incorporates four distinct reporting quadrants:
Quadrant 1: Hard Financial Realization
- Direct Contractor Offset: Quantifiable reductions in external agency, paralegal, or freelance expenditure.
- Software Consolidation: Savings realized by canceling legacy point solutions (such as single-purpose summarization tools, translation software, or specialized grammar checkers) replaced by enterprise AI suites.
- Realized Net Return: Net economic value generated after subtracting all licensing, verification, and enablement costs.
Quadrant 2: Operational Velocity and Throughput
- Median Deliverable Cycle Time: Measured reduction in end-to-end turnaround time for standard business units.
- Volume Capacity Index: Percentage increase in completed deliverables handled by existing headcount without overtime expansion.
- Workflow Bottleneck Relief: Quantifiable reductions in queue wait times for critical cross-functional approvals.
Quadrant 3: Quality and Risk Governance
- Post-Delivery Defect Rate: Percentage of deliverables requiring post-deployment correction compared to historical baselines.
- Verification Time Ratio: Average human audit minutes required per AI-generated output.
- Compliance Audit Adherence: 100 percent adherence to enterprise privacy rules, zero prompt-leak incidents, and validated data residency compliance.
Quadrant 4: Capital Allocation and Efficiency
- Cost per Productive Task: Total fully loaded cost (software plus human labor) required to complete a standardized deliverable.
- Active License Saturation: Percentage of provisioned licenses actively generating verified business workflows.
- Reclamation Velocity: Frequency and volume of dormant license reallocation to maintain capital discipline.
 View image detail
Opportunity Cost and Human Capital Reinvestment
A sophisticated ROI audit must evaluate not only what tasks are automated, but what high-value work replaces them. When organizations claim time savings without establishing deliberate reinvestment plans, freed cognitive capacity is almost invariably absorbed by ambient corporate friction: attending non-critical meetings, generating superfluous email threads, or engaging in unstructured tool exploration.
To convert liberated time into verifiable economic value, department heads must establish structured capacity reinvestment compacts prior to tool deployment. For example, if a team of corporate paralegals reclaims an estimated four hours per week per specialist through automated contract extraction, management must formally designate how those hours will be utilized: accelerating pending regulatory filings, conducting proactive vendor compliance reviews, or reducing external legal counsel reliance. By tying time savings to predetermined operational objectives, organizations ensure that productivity gains flow directly to the bottom line rather than dissolving into organizational overhead.
Establishing Governance Guardrails to Protect Realized Value
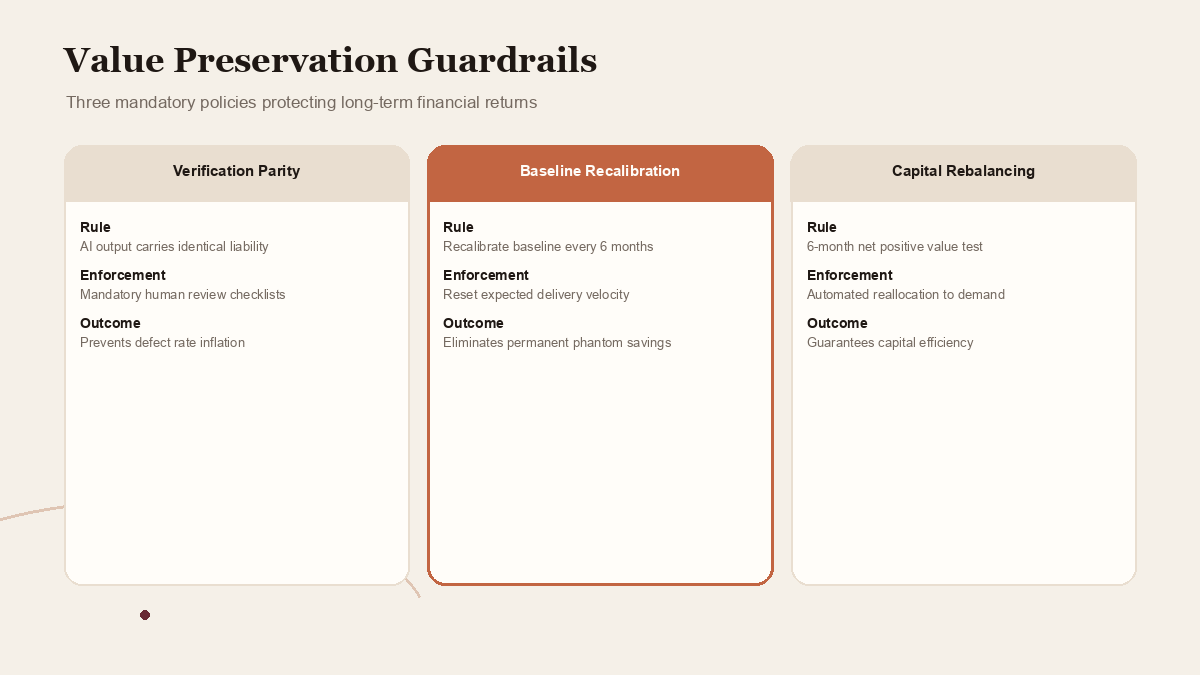
Even a highly successful deployment can see its financial returns eroded over time if governance discipline lapses. To ensure long-term value preservation, organizations must establish three permanent operational guardrails:
Guardrail 1: The Principle of Verification Parity
Never allow speed incentives to outpace verification protocols. Teams must understand that an error produced by an AI assistant carries identical legal, commercial, and professional accountability as an error produced by a human specialist. Documented verification steps must remain embedded in standard operating procedures.
Guardrail 2: Continuous Baseline Recalibration
As generative models improve and reasoning capabilities expand, initial baselines quickly become obsolete. Finance teams should recalibrate efficiency baselines every six months. What represented an accelerated workflow in early 2026 will become the baseline expectation by 2027. Recalibrating baselines prevents departments from claiming recurring "savings" on workflows that have become standard baseline operations.
Guardrail 3: Mandated Capital Rebalancing Triggers
If a business unit fails to demonstrate positive net value within six months of initial provisioning, executive policy should trigger an automatic operational review. The review determines whether the failure stems from inadequate training, poor workflow fit, or managerial friction. If structural blockers cannot be remediated within 30 days, licenses are reclaimed and reallocated to high-performing divisions.
 View image detail
Conclusion: Strategic Clarity in the Age of Generative AI
The era of uncritical enterprise AI experimentation is closing. As corporate budgets tighten and executive scrutiny intensifies, technology leaders who rely on superficial vendor marketing formulas will face growing credibility gaps in the boardroom.
True operational leadership requires the courage to measure reality. By adopting the principles of measurement science, isolating verifiable baselines, and accounting honestly for the hidden friction of verification and rework, organizations can separate genuine commercial transformation from technological theater. Generative AI holds extraordinary potential to amplify human capability and drive sustainable business value; but unlocking that value requires the discipline to measure it accurately, manage it rigorously, and govern it with unwavering accountability.
Sources
- OpenAI Official Documentation: How to Connect AI Usage to Business Value
- National Institute of Standards and Technology (NIST) CAISI Research: Accelerating AI Innovation Through Measurement Science
Checked for this article
Sources
Keep going
Related notes.
Automation and Agents
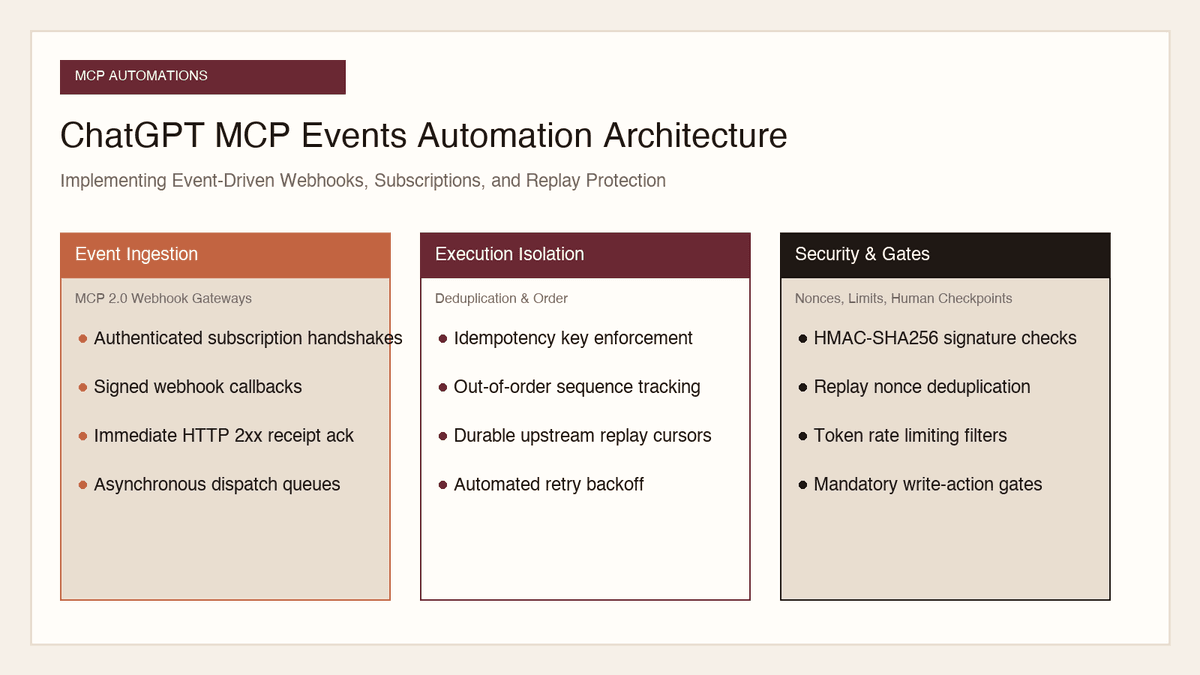
How to Implement MCP Events in ChatGPT: Event-Triggered Automations
Autonomous conversational agents no longer need to rely on wasteful polling loops. Here is how to implement event-triggered automations using ChatGPT MCP Events.
Read the article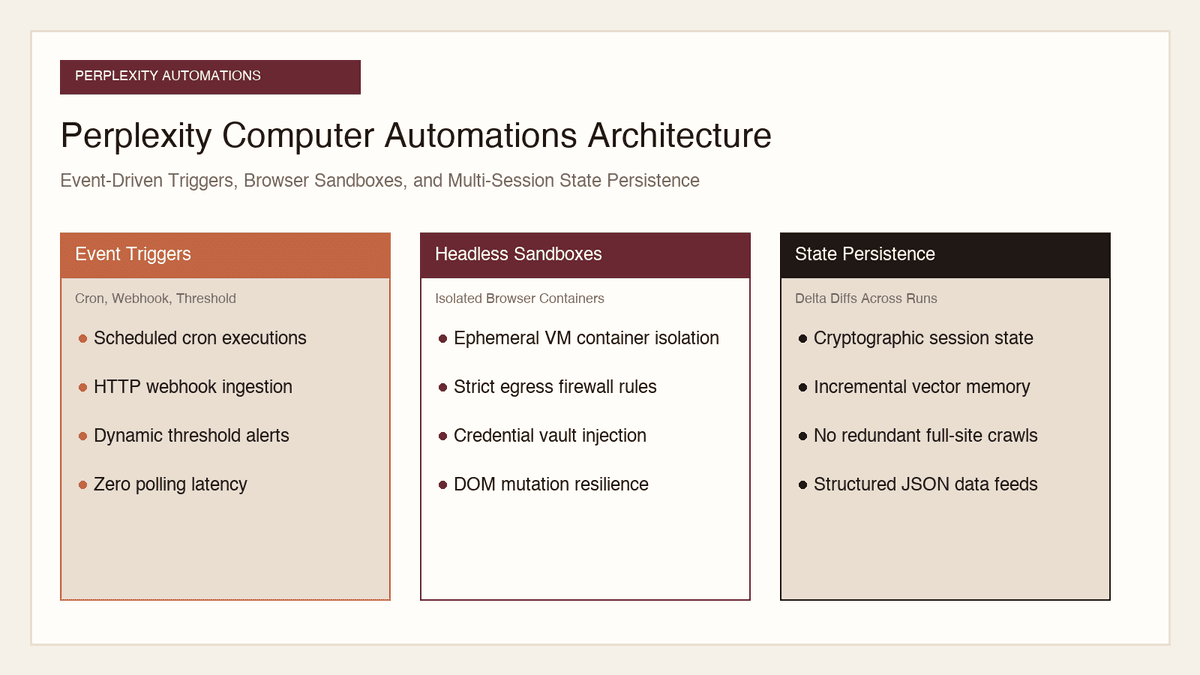
Automation and Agents
How to Build Recurring Web Automations with Perplexity Computer
Web scraping scripts break whenever a layout shifts. Here is how to build durable, recurring web automations using Perplexity Computer and persistent state.
Read the article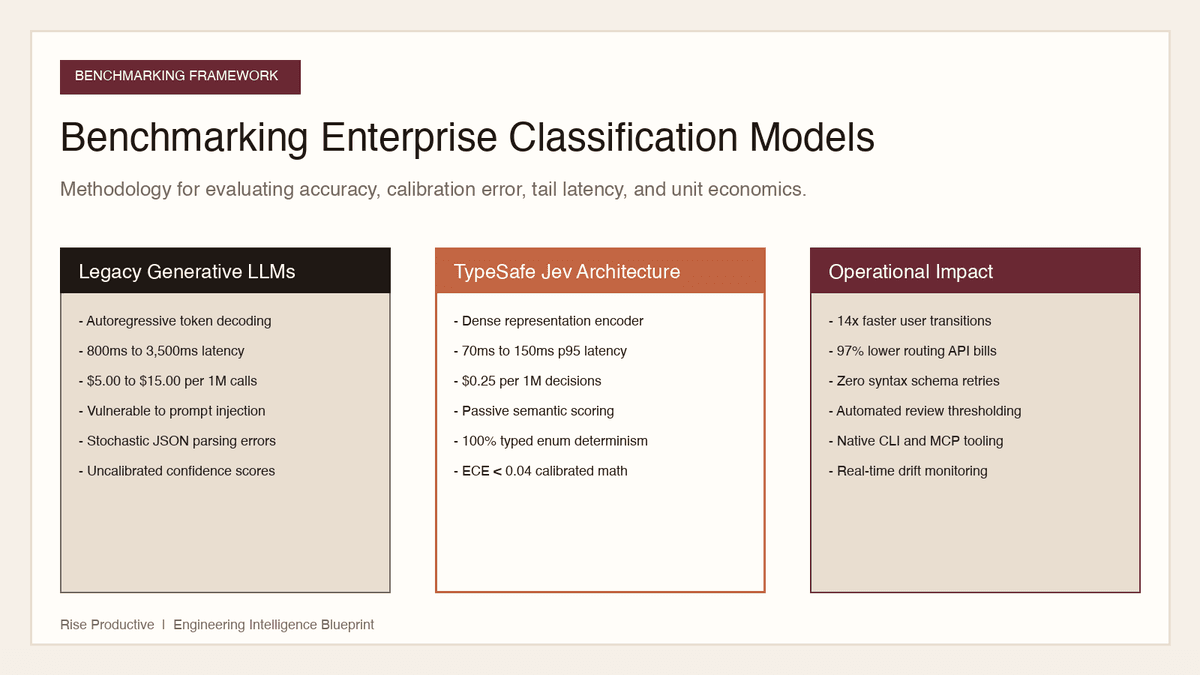
Automation and Agents
How to Benchmark Classifier Models: Latency, Cost, Determinism
Evaluating AI classifiers requires looking beyond static accuracy. Here is how to benchmark probability calibration, latency percentiles, and unit economics.
Read the article