
AI in Practice
How to Plan a ChatGPT Work Data Agent Pilot
A practical pilot brief for choosing a decision, source, metric, time period, and trusted comparison before asking ChatGPT Work Data to analyze company data.

On this page
- Treat the question as a decision brief
- Confirm that the Data plugin and source are actually available
- Choose one metric and name its owner
- Lock the period, comparison, and unit
- Prefer a question with a known reference
- Write a bounded first prompt
- Ask for evidence, not just explanation
- Decide when a dashboard helps
- Give each participant a role
- Write the stop conditions in advance
- The one-page brief to take into the pilot
- What to conclude after the first answer
- Start with a good question, then earn the dashboard
Before using ChatGPT Work’s Data agent to explain a business change, choose the decision its answer should support. “Tell me what is happening in the business” leaves the metric, data source, period, and comparison open. A pilot brief makes those choices visible before a plausible answer is mistaken for a decision.
OpenAI announced the Data agent on September 10, 2026. The current Help Center describes installing and using the Data plugin in ChatGPT Work and Codex. In both descriptions, workspace settings, connected source tools, and the user’s source permissions matter. This guide turns those facts into a small, auditable first test. It is a proposed method, not a report of a Data agent trial I ran. (OpenAI’s launch announcement; current setup and usage documentation)
 View image detail
Treat the question as a decision brief
Begin by writing down the action your team may take if the answer is credible. “Why did renewals fall?” is a useful conversation starter, but it does not yet say which renewals, which date range, what counts as a renewal, or what comparison would make the result surprising. A better first question names the decision: “Should we investigate the onboarding change before next week’s renewal review?” That gives the analysis a job. It does not tell the system what conclusion to reach.
Keep the decision reversible. A first pilot should answer something that can be checked against ordinary reporting and does not immediately change a customer record, send a message, or trigger a financial decision. OpenAI says Data can investigate a business question, build an interactive dashboard, and carry out actions users approve through connected tools. Those are product descriptions, not evidence that your specific connection, metric, or downstream action is already configured. Scope the first question so you can inspect the result before using it.
I would keep the first test deliberately boring. A narrow question with a known answer teaches you whether the connection, definitions, and evidence are in place. A sweeping executive dashboard can wait until the team knows which numbers survive scrutiny. The work is not to invent a clever prompt. It is to decide what a useful answer would have to show.
Confirm that the Data plugin and source are actually available
The product naming has changed slightly across the launch and operating documents. OpenAI’s September announcement introduces the “Data agent” in ChatGPT Work. Its current Help page calls the experience the “Data plugin” and explains that it is available in ChatGPT Work and Codex. It says the Data plugin must be available in the workspace, and that the relevant data-source plugin or app must also be enabled and connected. The administrator can set availability by role or group. Installing Data does not, by itself, connect a warehouse or grant access to its contents.
Before writing a question, identify the person who can confirm three things: whether Data appears for the intended role, whether the required source connector is enabled, and whether that user can connect an account with the intended permissions. Ask the source owner which system is authoritative for the metric. A team might have similar-looking data in a warehouse, a finance export, and an old dashboard. Picking the most convenient source is not the same as picking the source the business trusts.
The launch announcement lists examples including Amazon Redshift, Datadog, BigQuery, ClickHouse, Databricks, MongoDB, and Snowflake, along with documents and files from Google Drive and SharePoint. It also names business context sources and integrations with BI products. That is a launch list, not a guarantee that any one workspace has them. Current Help repeats the availability caveat: source plugins, apps, account setup, supported actions, and permissions vary. In its September 10 launch reporting, VentureBeat noted OpenAI had not published an accuracy benchmark for the agent; its account of an internal comparison is not an independent evaluation. (VentureBeat’s launch report)
 View image detail
Choose one metric and name its owner
A metric name often sounds more precise than it is. “Active customer,” “qualified lead,” “net revenue,” and “retained account” can each have several legitimate definitions. One team may count an account when a contract is signed; another only after payment. A retention rate may use logos, seats, or revenue. The agent cannot choose which definition represents your business unless your organization has supplied the relevant definition and you tell it which source to use.
For the pilot, record the metric owner, the canonical definition, the data source, and the calculation or dashboard where the team currently relies on it. If the definition lives in a semantic layer, an internal data dictionary, or an existing BI model, name that specific artifact. The launch says Data can use company terminology, custom calculations, relationships, semantic layers, and trusted dashboards. The Help page similarly says business definitions can improve analysis and recommends telling Data which definition or source to use when the team has a preferred one. The existence of a semantic layer is not enough if the metric is ambiguous or stale.
Write down what is excluded as well as what is counted. If “new customer” excludes internal accounts, trials, or duplicate records, those rules belong beside the definition. If no owner can explain the metric consistently, stop before asking Data to compare it. That is useful pilot information. The missing work is not better prompt wording; it is a decision about what the number means.
Lock the period, comparison, and unit
Now make the time window explicit. “Last month” can mean the previous calendar month, the last 30 days, or a financial reporting period. A daily dataset may be stored in UTC while the business reviews a local calendar. Late-arriving events, billing corrections, or restatements can change a result after the first query. Those details do not make the analysis impossible. They give you the conditions under which two answers should be compared.
State the start and end dates, time zone, comparison period, unit, filters, and any exclusions that matter. For a revenue question, specify currency and whether the number is gross, net, recognized, or booked. For a count, state the entity being counted and how duplicates are handled. For a rate, name the numerator and denominator. If you want a segment comparison, say which segments and whether each period uses the same membership rule.
This is where a source-of-truth dashboard becomes valuable. The comparison is fair only when the pilot and the trusted report use the same period, unit, filters, and metric definition. If they intentionally differ, preserve the difference rather than forcing the totals to match. OpenAI’s Help Center recommends checking the source, period, filters, and metric definition behind an answer, then asking Data to compare those details when its result differs from an existing report. That is a good operating instruction because it replaces “the AI got it wrong” with a list of testable possibilities.
 View image detail
Prefer a question with a known reference
Your pilot needs a reference answer before it needs a beautiful dashboard. The reference might be an analyst-reviewed report for the same week, an approved query, or a spreadsheet whose metric owner can explain the calculation. Save its date, source, filters, and value or expected range in the brief. Do not pretend that one historical result is infallible. It is simply the current comparison point, with its own definition and limits stated.
Choose one main expectation and one useful boundary. For example, perhaps weekly support volume should reconcile to a queue report within an agreed treatment of duplicates, and a restricted role should not see records outside its assigned region. That wording describes what to check. It does not assert that Data will pass. Keep the reference private if it contains sensitive company information, and use only the access approved for the pilot.
The reference also helps separate a new insight from a calculation discrepancy. If the agent finds a possible driver, first determine whether it used the same data and definition as the reference. A mismatch might reflect a different period, a filter, an event correction, a relationship between tables, or a genuine analytical error. Each possibility calls for a different follow-up. A confident explanation is not a substitute for tracing which rows and calculation support it.
This is Rise commentary: a low-risk pilot is successful when it teaches the team what to validate, even if the first answer is “we need a better definition.” That is more valuable than treating a plausible paragraph as a shortcut to a decision.
If a successful pilot may become a recurring workflow, use Rise's Work Worth Doing test to decide whether the task merits automation before adding a permanent agent or dashboard process.
Write a bounded first prompt
Once the source and definition are clear, write the prompt as a compact specification. Use the explicit @Data mention at first if the experience is available, as the Help Center recommends for building familiarity. Name the data source or report, metric, time range, comparison, filters, unit, and the evidence you want back. Ask it to list the definitions and assumptions it used, and to point out missing or inconsistent data before it recommends a next step.
Here is a hypothetical template, not a tested prompt or a result:
Using [named approved source], compare [metric with its canonical definition] for [exact period] against [comparison period]. Apply [filters and exclusions], report [unit and timezone], and show the source, calculation, rows or evidence behind any material finding. State which assumptions you used and where the data is incomplete. Do not send messages, publish a dashboard, or change another system. First tell me what needs a human check.
The bracketed text is not filler to leave in place. It forces the request owner to supply choices that the organization actually means. If there are two possible definitions, ask for a side-by-side comparison rather than silently choosing one. If the exact source cannot be selected by the user, ask the administrator or data owner to make the source path explicit. A prompt cannot repair an unavailable connector.
The better the question, the less likely the team is to confuse a follow-up exploration with the metric itself. Keep the initial answer focused on one decision. After that, ask a separate question to inspect a segment, validate an unexpected movement, or test an alternative explanation. Each follow-up should say what it changes, so reviewers know whether the analysis is still comparable to the reference.
 View image detail
Ask for evidence, not just explanation
OpenAI says users can ask follow-up questions to investigate findings and review the evidence behind them. Use that ability directly. Ask which source objects, rows, definitions, date range, filters, joins, and calculations support the result. Ask what was excluded and whether any field was missing. A business explanation is more useful when the reader can trace it back to evidence, and less persuasive when the evidence is hidden behind a polished dashboard.
Do not stop at a list of sources. A source name tells you where data came from, not whether the right metric was computed. Check that the group labels map to the expected business definitions and that the comparison uses the same unit and period as your reference. If the result uses a semantic layer or existing dashboard, verify the version and owner of that context. If the answer says “sales fell because a campaign ended,” check whether the source actually supports cause or only shows timing. A correlation may identify where to look next without proving why the change happened.
That distinction should shape the language of the result. “The decline is concentrated in region A” may be supported by a grouped calculation. “Region A caused the decline” asks for stronger evidence about the mechanism. A first-pass analysis can suggest a hypothesis, but the next step should be an independently checkable query or source document, not a more forceful sentence. Mark hypotheses as hypotheses in the notes you keep for the pilot.
 View image detail
Decide when a dashboard helps
An interactive dashboard is useful when someone will revisit the same decision, inspect the same measures, or compare changes over time. If the pilot asks one question once, an evidence-backed response may be enough. A dashboard can add maintenance, audience, refresh, and ownership questions before it adds value. Use it when the shape of the decision benefits from visual comparison or a recurring view.
OpenAI’s announcement says Data can turn its analysis into an interactive dashboard with visualizations that the team can edit, share, and refresh. The Help Center adds that users can request metrics, breakdowns, comparisons, or layout adjustments, and that Data can work with connected BI products. Sigma’s launch post says its plugin is available to OpenAI enterprise customers with Sigma Act, Analyze, or Build licenses. It distinguishes asking and querying from dashboard creation: asking and querying are available to those licensed Sigma users, while building dashboards requires a Build license. That is Sigma’s description of its own integration, not a general rule for every BI connector or evidence of a general Data-agent outcome. (Sigma’s partner announcement)
Before requesting a dashboard, name its audience, the question it should answer, the definitions it will display, the refresh cadence, and the person who owns changes. A dashboard without those choices can spread a draft analysis farther than the original conversation. It can also imply that every chart is maintained and approved when no one has agreed to maintain it.
 View image detail
Give each participant a role
Even a small pilot has several distinct responsibilities. The workspace administrator decides whether Data and source plugins are available to a role or group. The data owner confirms source and metric definitions. The analyst or business owner writes the question, compares the result with trusted reporting, and decides whether the answer meets the decision need. A dashboard owner is responsible for any recurring view and its audience. One person can hold more than one role, but the duties should still be explicit.
Ask the administrator to confirm the intended workspace and available plugins. Ask the data owner which metric and source should be used. Ask the business owner which decision will be informed and what evidence would change it. If no one can define the expected audience, avoid publishing the dashboard. The Help Center explains that administrators control plugin availability and source connections, while the connected account's existing permissions limit what it can read. It also warns that plugin installation is separate from app access and account setup.
The role map prevents a common handoff problem: one person assumes another person approved the definition, while the other believes the tool selected it. Record the decision owner next to the metric, the source owner next to the connection, and the publisher next to the dashboard. A simple owner field is less glamorous than an AI workflow diagram, and much more useful when a number changes next week.
For a related example of mapping what an agent can access and where approval belongs, see how Notion Agent MCP connections shape access and approval. The products are different, but the useful habit is the same: define boundaries at the connection and action level instead of assuming that installing an agent answers every governance question.
Write the stop conditions in advance
A pilot brief needs conditions under which the team will pause. Stop if the metric has conflicting definitions, the connected source is not the approved one, the answer cannot identify its period or filters, the result differs from the trusted report without an explainable reason, or the intended user can see data outside the approved scope. These are proposed checks. No test of those conditions has been performed here.
Also define what will not happen during the pilot. For example: no external sharing, no production write, no automated follow-up, no customer-facing action, and no permission changes. OpenAI’s launch says the agent can carry out actions users approve through connected tools. Current documentation is more specific that the available actions depend on the connected tool, account permissions, workspace controls, and approvals. There is no single universal action behavior to assume from the announcement alone.
Write the pause conditions where reviewers can see them. This avoids making a bad result feel like an embarrassment that must be explained away. If the pilot exposes a gap in the source definition, the result is a useful operational finding: the team knows what needs to be fixed before it scales analysis. The purpose is not to catch the model out. It is to protect the decision from unsupported confidence.
 View image detail
The one-page brief to take into the pilot
Copy this into a planning note and fill in each line with the people who own it:
- Decision: What to record: The reversible decision this analysis could inform
- Question: What to record: One narrow question in ordinary language
- Source: What to record: Approved dataset, report, or system and its owner
- Metric: What to record: Canonical name, definition, unit, exclusions, and authority
- Period: What to record: Exact start and end, comparison window, and time zone
- Filters: What to record: Population, segments, and exclusions that apply equally
- Reference: What to record: Existing trusted report, query, or expected range
- Identity: What to record: Intended user, role, source-account connection, and access scope
- Evidence: What to record: Source, calculation, filters, assumptions, and missing-data notes to inspect
- Dashboard: What to record: Whether a recurring, maintained view is needed, and for whom
- Stop rules: What to record: Conditions that pause the pilot and who resolves each one
- Actions: What to record: Explicitly allowed follow-up actions and actions kept out of scope
The brief should be short enough to use and specific enough to challenge. If a stakeholder cannot complete the metric, source, comparison, or reference fields, take that gap to the responsible owner before asking for analysis. Do not fill it with a plausible guess.
 View image detail
What to conclude after the first answer
The first pilot should leave behind a record of the request, source, metric definition, period, comparison, account or role, answer, evidence, reviewer questions, and disposition. That record makes it possible to repeat the same request or see why the next run differs. It is not a scorecard for the Data agent. It is a way for the business to evaluate whether the analysis meets its own requirements.
If the number reconciles and the evidence is legible, decide whether the question deserves a repeatable dashboard. If it does not reconcile, find out whether definitions, source timing, filters, joins, or permissions explain the gap. If the answer suggests a new hypothesis, validate it with an appropriate source before turning it into a recommendation. If the access or sharing boundary is unclear, stop. Each of those outcomes is more specific than “the agent worked” or “the agent failed.”
The launch materials include examples from OpenAI and named customer organizations. Those are company-provided reports and should stay attributed. They do not predict how a different organization's data, semantic definitions, connector, account, and reviewer will behave. The announcement does not supply a universal price or a cross-company reliability benchmark for a Data agent pilot, so this article does not estimate cost savings or accuracy.
Start with a good question, then earn the dashboard
The first useful Data agent experiment is not a broad request to explain the company. It is a small decision with a named source, clear metric, fixed period, fair comparison, and reference answer. OpenAI’s current guidance supports checking the source, time range, filters, and metric definition. The rest of the pilot brief makes those choices visible and gives the reviewer a safe way to decide what happens next.
You may discover the connection is unavailable, the metric owner needs to clarify a definition, the answer differs from a trusted report, or the dashboard is not worth maintaining. That is still progress because it identifies the actual dependency. Treat the pilot as a working conversation among the people who own the source, the decision, and the result. Build a dashboard only after the evidence and its audience are clear.
Checked for this article
Sources
- OpenAI, "Now everyone can put data to work"OpenAI
- OpenAI Help Center, "Using the Data plugin in ChatGPT Work and Codex"OpenAI
- VentureBeat, "OpenAI's new data agent skips the one thing rivals like Databricks are racing to publish: a benchmark"VentureBeat
- Sigma, "The Sigma plugin is live for ChatGPT Work and Codex"Sigma
Keep going
Related notes.
AI in Practice
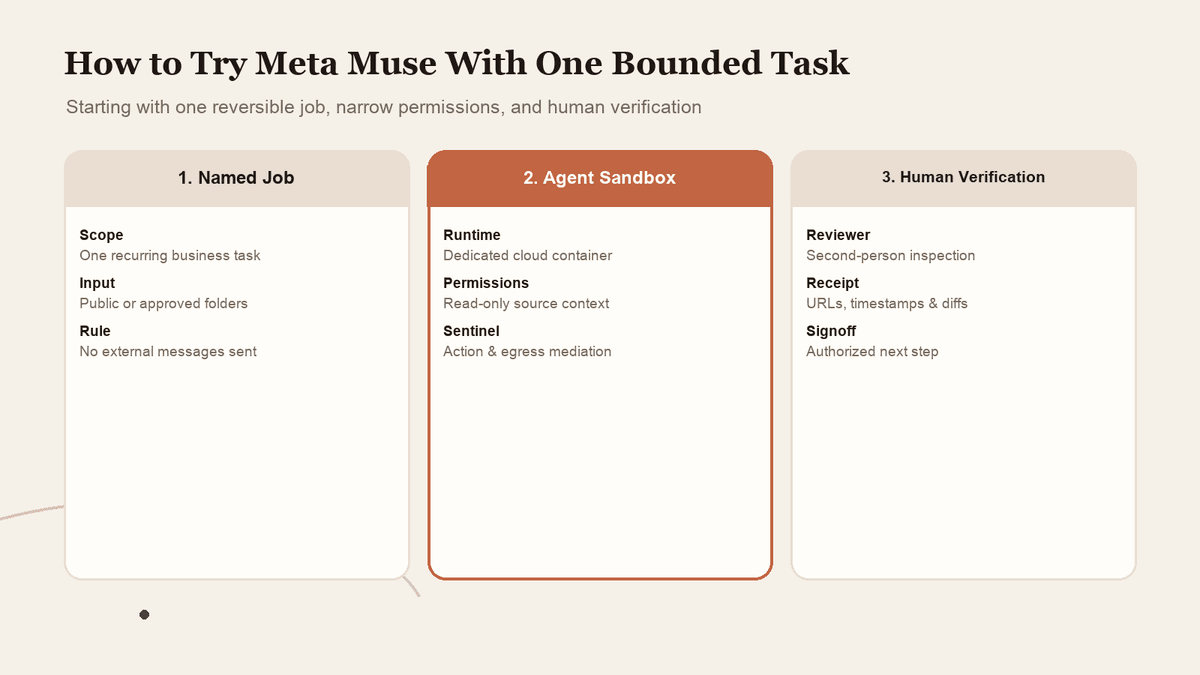
How to Try Meta Muse With One Bounded Task and Limited Access
A personal agent can look useful long before you know whether you should connect everything. Start with one reversible job, narrow permissions, and verified completion.
Read the article
AI in Practice
ChatGPT Sites and Connected Apps: Who Can See What?
A shared Site does not make every coworker\x27s source account the same. Map the separate controls, test a normal member\x27s path, and make access understandable before rollout.
Read the article
AI in Practice
ChatGPT Sites Plugins: How to Scope MCP Tools Before You Share
A ChatGPT Site can host a supported plugin, but the useful question is what its tools should be allowed to do. Here is a practical contract-and-test process before you share.
Read the article